
Alerts Introduction
Alerts are first-class entities in Librato and can be accessed from the Alerts icon in your navigation bar.
Alerts Central
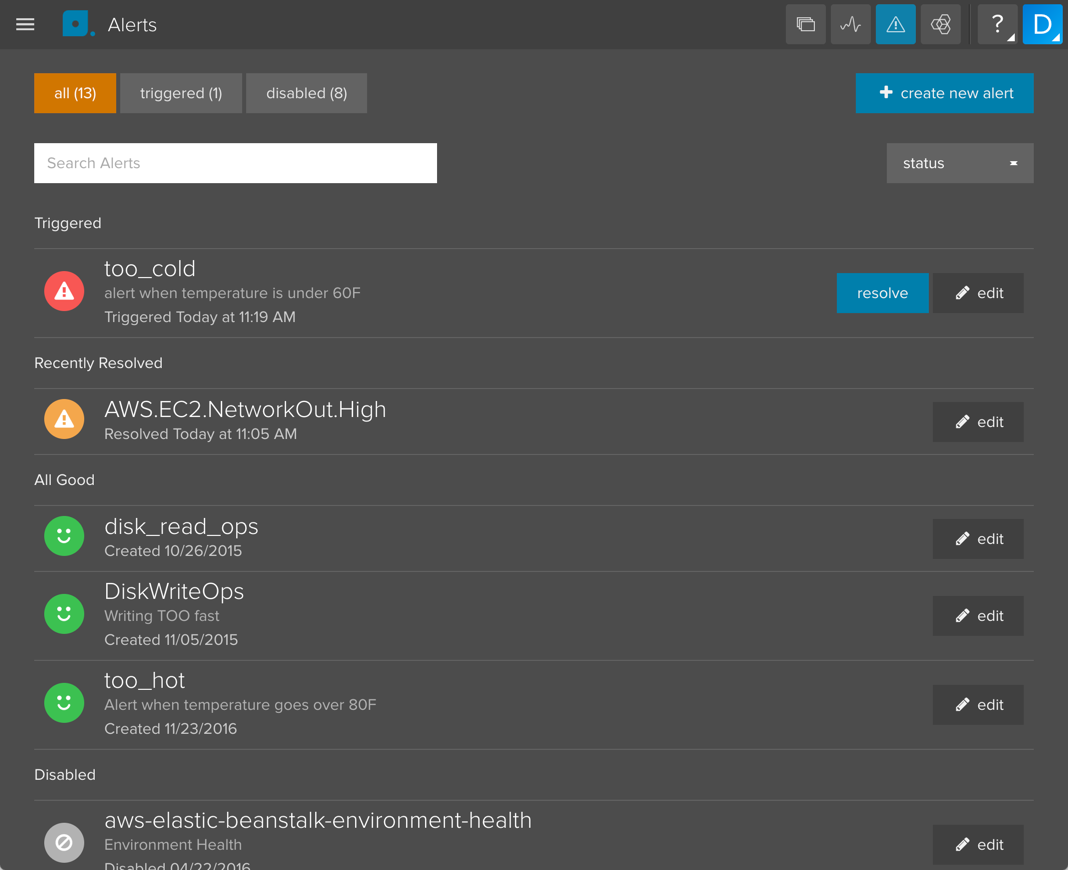
Clicking on the Alerts icon in the menu bar takes you to the main view - a list of all enabled alerts and their current state. From here you can drill down into alerts, edit them, create new ones, sort, search by name… you get the picture - that’s why we call this Alerts Central.
Create New Alert
Clicking on the “create new alert” button opens up a form with the following options:
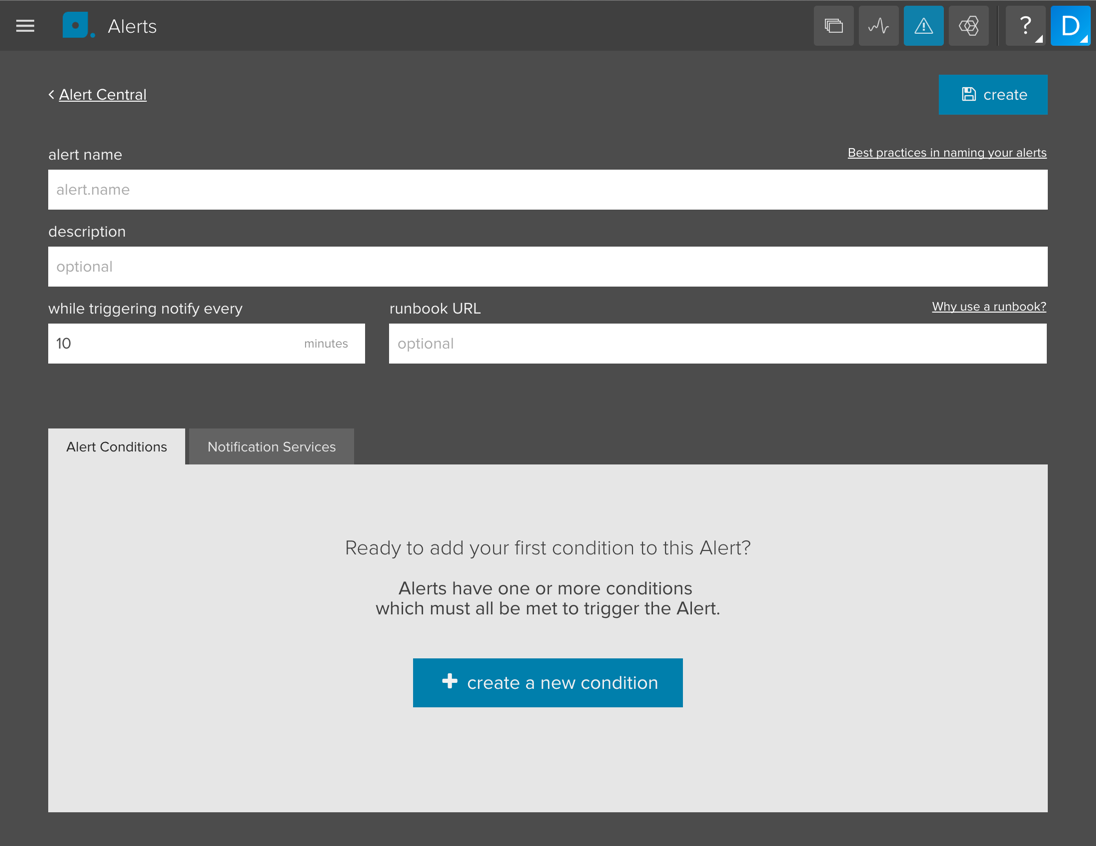
alert name: Pick a name for your alert. Alert names now follow the same naming conventions as metrics. We suggest using names that describe the environment, application tier & alert function clearly such asproduction.frontend.response_rate.sloworstaging.frontend.response_rate.slow.description: This is an optional field - keep in mind that others may need to know what this alert is for so we recommend using it if you are setting up alerts for a team.while triggering notify every: This re-notify timer lets you specify how long to wait before the alert can be fired again. NOTE: The re-notify timer is global, so if the timer is set to 60 minutes and you are alerting on a metric that has a cardinatily > 1 and two streams trigger the alert consecutively, say within a few minutes, the first stream will trigger a notification whereas the 2nd will not.runbook URL: To ensure that alerts are actionable, add a url to a document (wiki page, gist, etc.) that describes what actions should be taken when the alert fires.
Alert Conditions is where you define what triggers the alert. Alerts can have one or more conditions which must all be met to trigger the Alert. We go into more depth about this further down in this article.
NOTE: Alerts require more than one measurement before they will trigger.
Notification Services
Under the Notification Services tab you can link an alert to any number of notification services.
To tie an alert to a notification service just click on the service and select any of the destinations that are configured. You have to have at least one notification service selected before you can save the alert.
You can see all the available services on the Integrations page under the Outbound section.
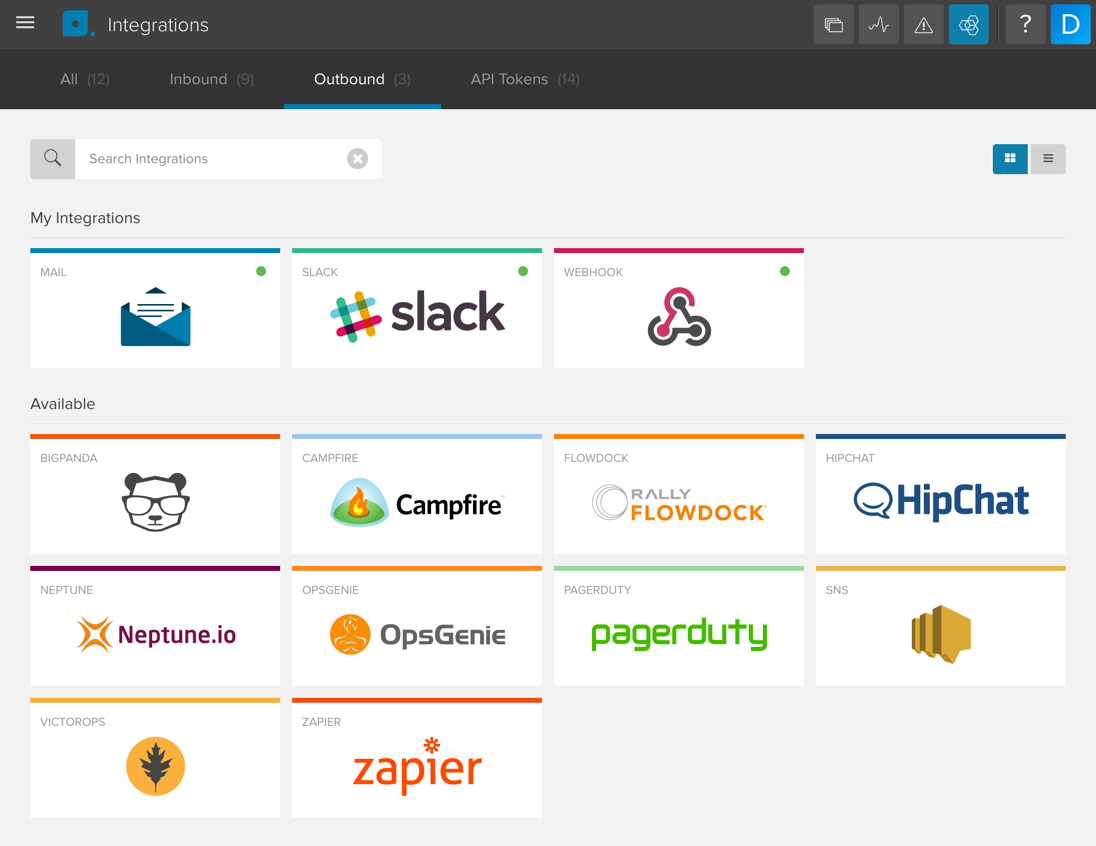
These are the services that Librato supports:
Defining Alert Conditions
Under the Alert Conditions tab you can create new conditions or edit existing ones. If you have several alert conditions, they ALL have to be met before the alert triggers. NOTE: Alert conditions are completely independent, so if condition 1 is triggered by tag set X and condition 0 is triggered by tag set Y, the alert will fire. To create alerts that are tag set dependent we recommend using Alerts on Composite Metrics.
Click on the “+ create a new condition” button to bring up the alert condition form.
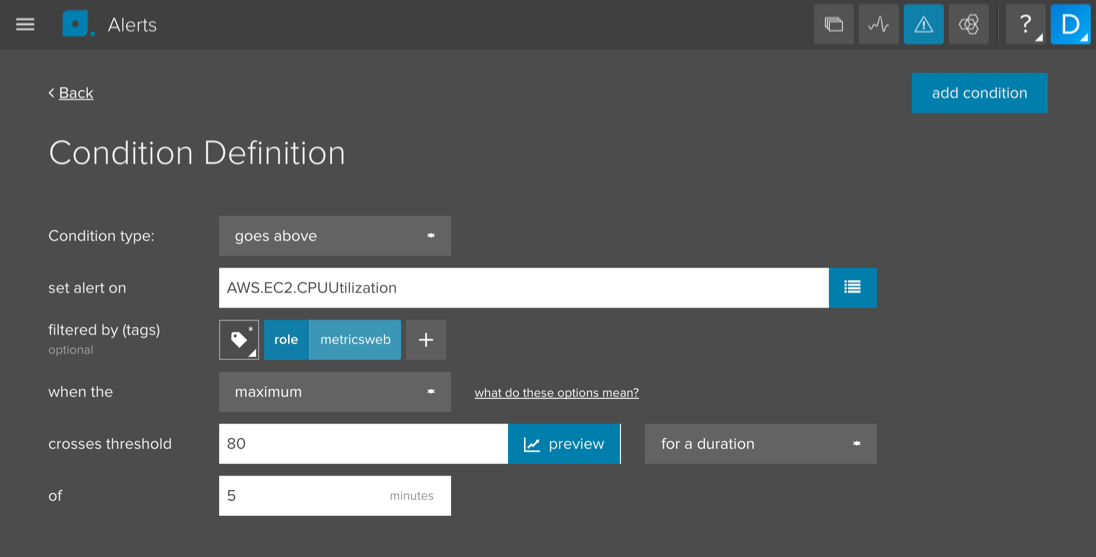
The alert condition reads like a sentence. In the example above the condition would be:
Set an alert on AWS.EC2.CPUUtilization metric filtered to the role tag
that matches metricsweb when the maximum exceeds a threshold of 80 for 5 minutes.
Let’s go over the condition options:
condition type: The type of threshold you are setting. You can trigger alerts when values exceed or fall below a threshold or you can use the “stops reporting” option to check a metric’s “heartbeat”.goes above: Alert will fire if the incoming measurement value exceeds the threshold.falls below: Alert will fire if the incoming measurement value falls below the threshold.stops reporting: Alert will fire if a metric that has reported previously stops reporting. ** NOTE**: for this type of alert, it is a good idea to set the period on the metrics being checked. Our alert system goes back N periods to determine the “last reported” value, and will assume the period is 60s if unspecified, which could result in false positives.
set alert on: Select a metric (or persisted composite metric)filtered by (tags): Define a tag set to filter the metric on. For example adding the tagenvironmentwith the valueproductionwill only evaluate metric streams that match that condition. Each stream will be checked independently against the alert conditions. This means that alerts will fire when any of the streams violates the conditions.when the: For gauges, choose the statistic to alert on: average, sum, minimum, maximum, count, or derivative. Please note that if you select “derivative” for a gauge, the derivative of the sums will be used. For thestops reportingcondition, this field is not shown.crosses threshold: the value to be checked against (for each metric stream) which determines whether the alert will be fired. There are two trigger options:for a duration: Set the time window within which the trigger condition must be met for every measurement coming in. For example, if you only want to be notified if CPU is over 80 for at least 5 minutes, set theoffield to 5 minutes. NOTE: The maximum value of this field is 60 minutes.immediately: Fire the alert as soon as any measurement violates the condition.
Click on “add condition” to save the condition.
Once you have completed the form, added at least one alert condition and tied it to at least one notification service, you can click on the “create” button to save the alert.
Automated Alert Annotations
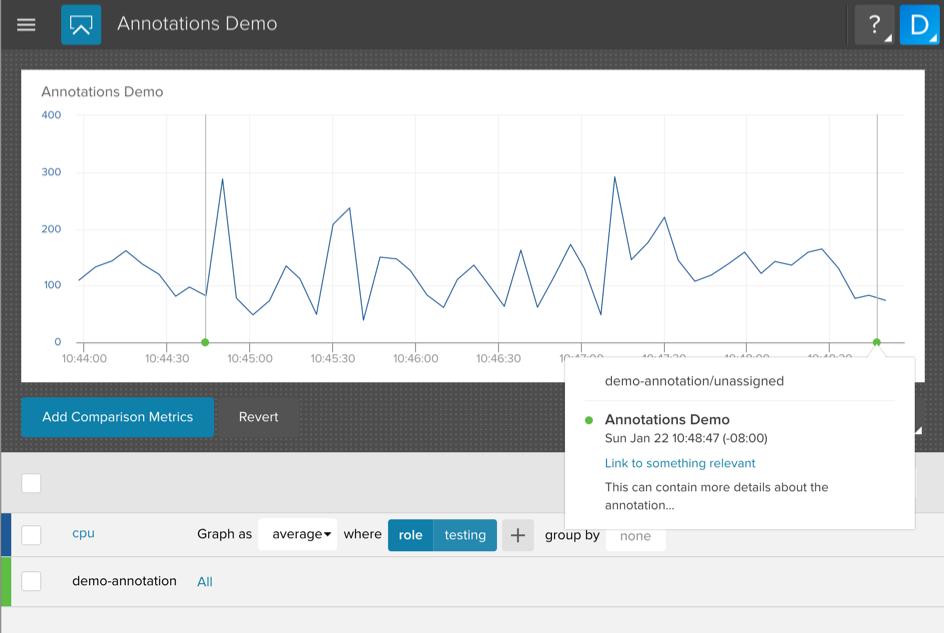
Every time an alert triggers a notification, we automatically create a matching annotation event in a special librato.alerts annotation stream. This enables you to overlay the history of any given alert (or set of alerts) on any chart as depicted below:
The naming convention for a given alert will take the form:
librato.alerts.#{alert_name}. For each notification that has fired,
you will find an annotation in the annotation stream with its title set
to the alert name, its description set to the list of conditions that
triggered the notification, and a link back to the original alert
definition. This feature will enable you to quickly and easily correlate
your alerts against any combination of metrics.
Automatic Clearing of Triggered Alerts
With alert clearing you will receive a clear notification when the alert is no longer in a triggered state. For threshold and windowed alert conditions, any measurement that has returned to normal levels for all affected metric streams will clear the alert. For absent alert conditions, any measurement that reappears for all affected metric streams will clear the alert.
When an alert clears it sends a special clear notification. These
are handled differently based on the integration. Email, Campfire,
HipChat and Slack integrations will see an “alert has cleared”
message. For PagerDuty customers, the open incident will be resolved.
OpsGenie customers will see their open alert closed. Webhook integrations
will contain a clear attribute in the payload as follows:
{
  "payload": {
    "alert": {
       "id": 6268092,
       "name": "a.test.name",
       "runbook_url": "",
       "version": 2
    },
    "account": "youremail@yourdomain.com",
    "trigger_time": 1457040045,
    "clear": "normal"
  }
}
When you view an alert inside the Librato UI you will now see one of two new states at the top of the page. Under normal conditions you will see the alert status highlighted in green to indicate everything is ok:

If the alert has actively triggered and has not cleared yet, it will include a resolve button that will manually clear the alert. This can be useful in cases where a source reports a measurement that violates a threshold, but then subsequently stops reporting.

If the condition of the alert is still actively triggering, the alert will return to the triggered state on the next incoming measurement(s).
Auto-clearing when metric streams stop reporting on a threshold alert
For time-windowed threshold alerts, if all metric streams that were in violation subsequently stop reporting, the alert will be cleared after 1 threshold period. Example: If the alert condition is “goes above 42 for 5 minutes” and “metric stream 1” violates the condition, the alert will trigger.
If metric stream 1 later stops reporting measurements, the alert will be cleared 5 minutes afterward. Similarly, if metric stream 1 and metric stream 2 are both in violation, and metric stream 1 stops reporting but metric stream 2 continues to be in violation, the alert will remain in the triggered state. If metric stream 2 then stops reporting, the alert will be cleared.
All triggered alerts are automatically cleared after a period of 3 days if they fail to report any new measurements.
Alerts on Composite Metrics
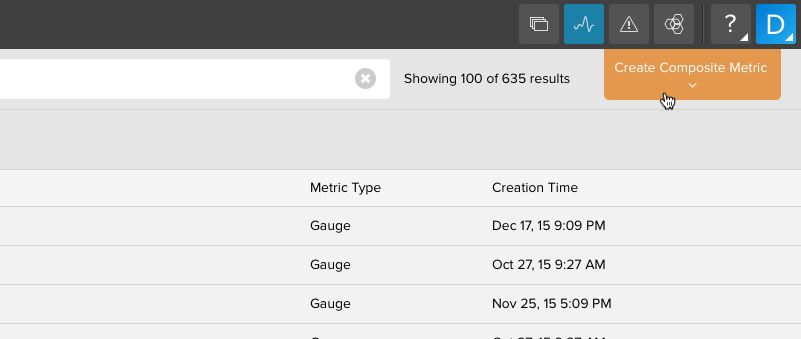
Under the Metrics view you can use the Create Composite Metric button to create a composite metric with a persisted definition, which will be available globally like any other metric. It can also be used inside an alert.
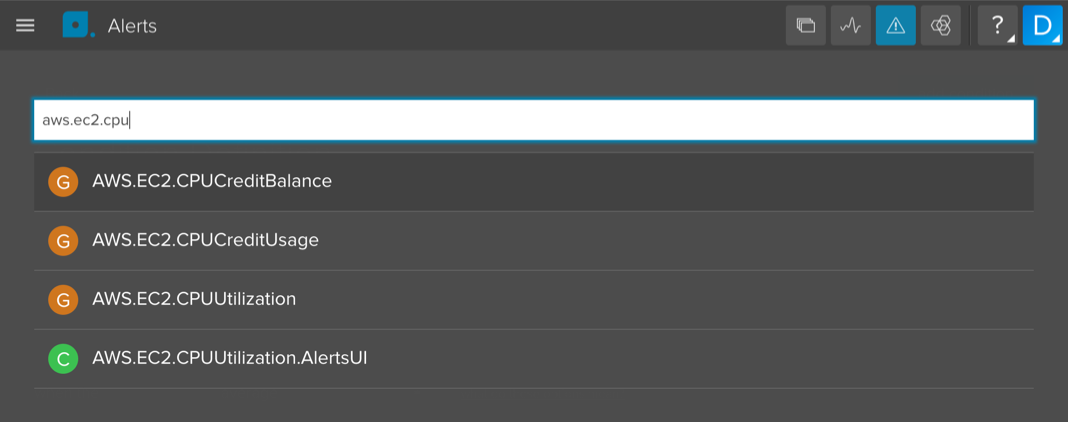
Persisted composite metrics can have display names and will show up as a metric denoted by a “C” in your metrics list when you are picking a metric for your alert (“G” stands for gauge).
Caveats:
When the alerting system polls for values on a composite metric, it
currently is limited to the past 60 minutes of data. Therefore, if for example,
you have an alert set on a derive() function, there must be 2 points
within the last 60 minutes in order for your alert to trigger.
Saved composites must result in a single time-series to be alerted on, so..
[s("metric1", {"name":"foo"}), s("metric2", {"name":"bar"})]
…will not work. A metric returning multiple metric streams will work, e.g.:
s("metric1", "name":"*")