
Composite Metrics
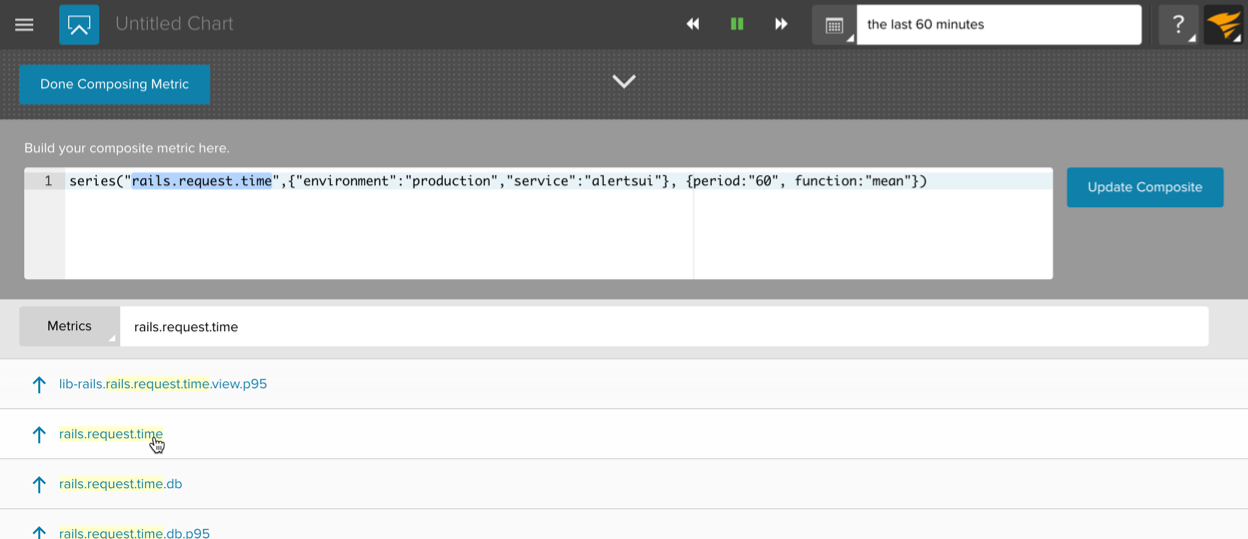
Composite metrics let you define a new higher-level metric by specifying an arbitrary set of mathematical transformations to perform on a selection of native metrics you’re sending us. You “compose” a new higher-level metric using the native metrics you send us as inputs. Alternatively you can think of it as a way to specify complex queries against your native metrics. To create a composite metrics simply open the Composite Metric Editor.
The Composite Metric Editor provides some simple features that help with editing composite functions such as parenthesis matching, auto adding sets of quotes and parenthesis, and the ability to import the result of a metric search directly into the function.
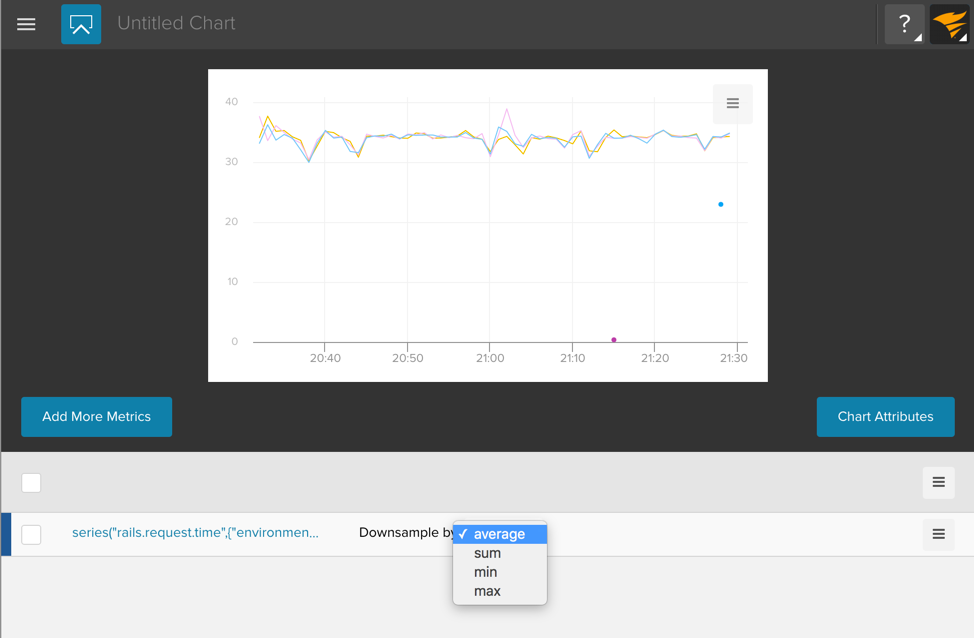
Remember to always click on “Update Composite” after making any changes to the composite function. When you are done editing the composite, click on “Done Composing Metric”. The chart will show the data generated by the composite. In the data stream row under the chart you can select a downsample aggregation function. This means that if there are too many data points for the number of pixels available to draw the chart, we need to aggregate data. The options available for aggregation are:
- average
- sum
- min
- max
When you hover over any of the stream rows, you’ll see a hamburger menu appear on the far right. If you click on the menu you will see three options:
- Attributes…
- Duplicate
- Delete
If you select “Attributes…” you will be able to configure the Stream Attributes.
To learn more please read our Tutorial:
… and our Language Specification: