Librato Introduction
Librato was designed from inception as a generic, scalable, redundant, monitoring platform, optimized for time-series data. You start by sending data to Librato via any of the many turn-key integrations, or POST directly to our RESTful API. You can then create beautiful dashboards with charts that showcase your metrics and allow you to filter and pivot the data until you hone in on a specific issue. In parallel you set up alerts on the most important metrics that notify you via email, chat, or your favorite escalation service so that you’re always aware of the health of your service.
After first signing up
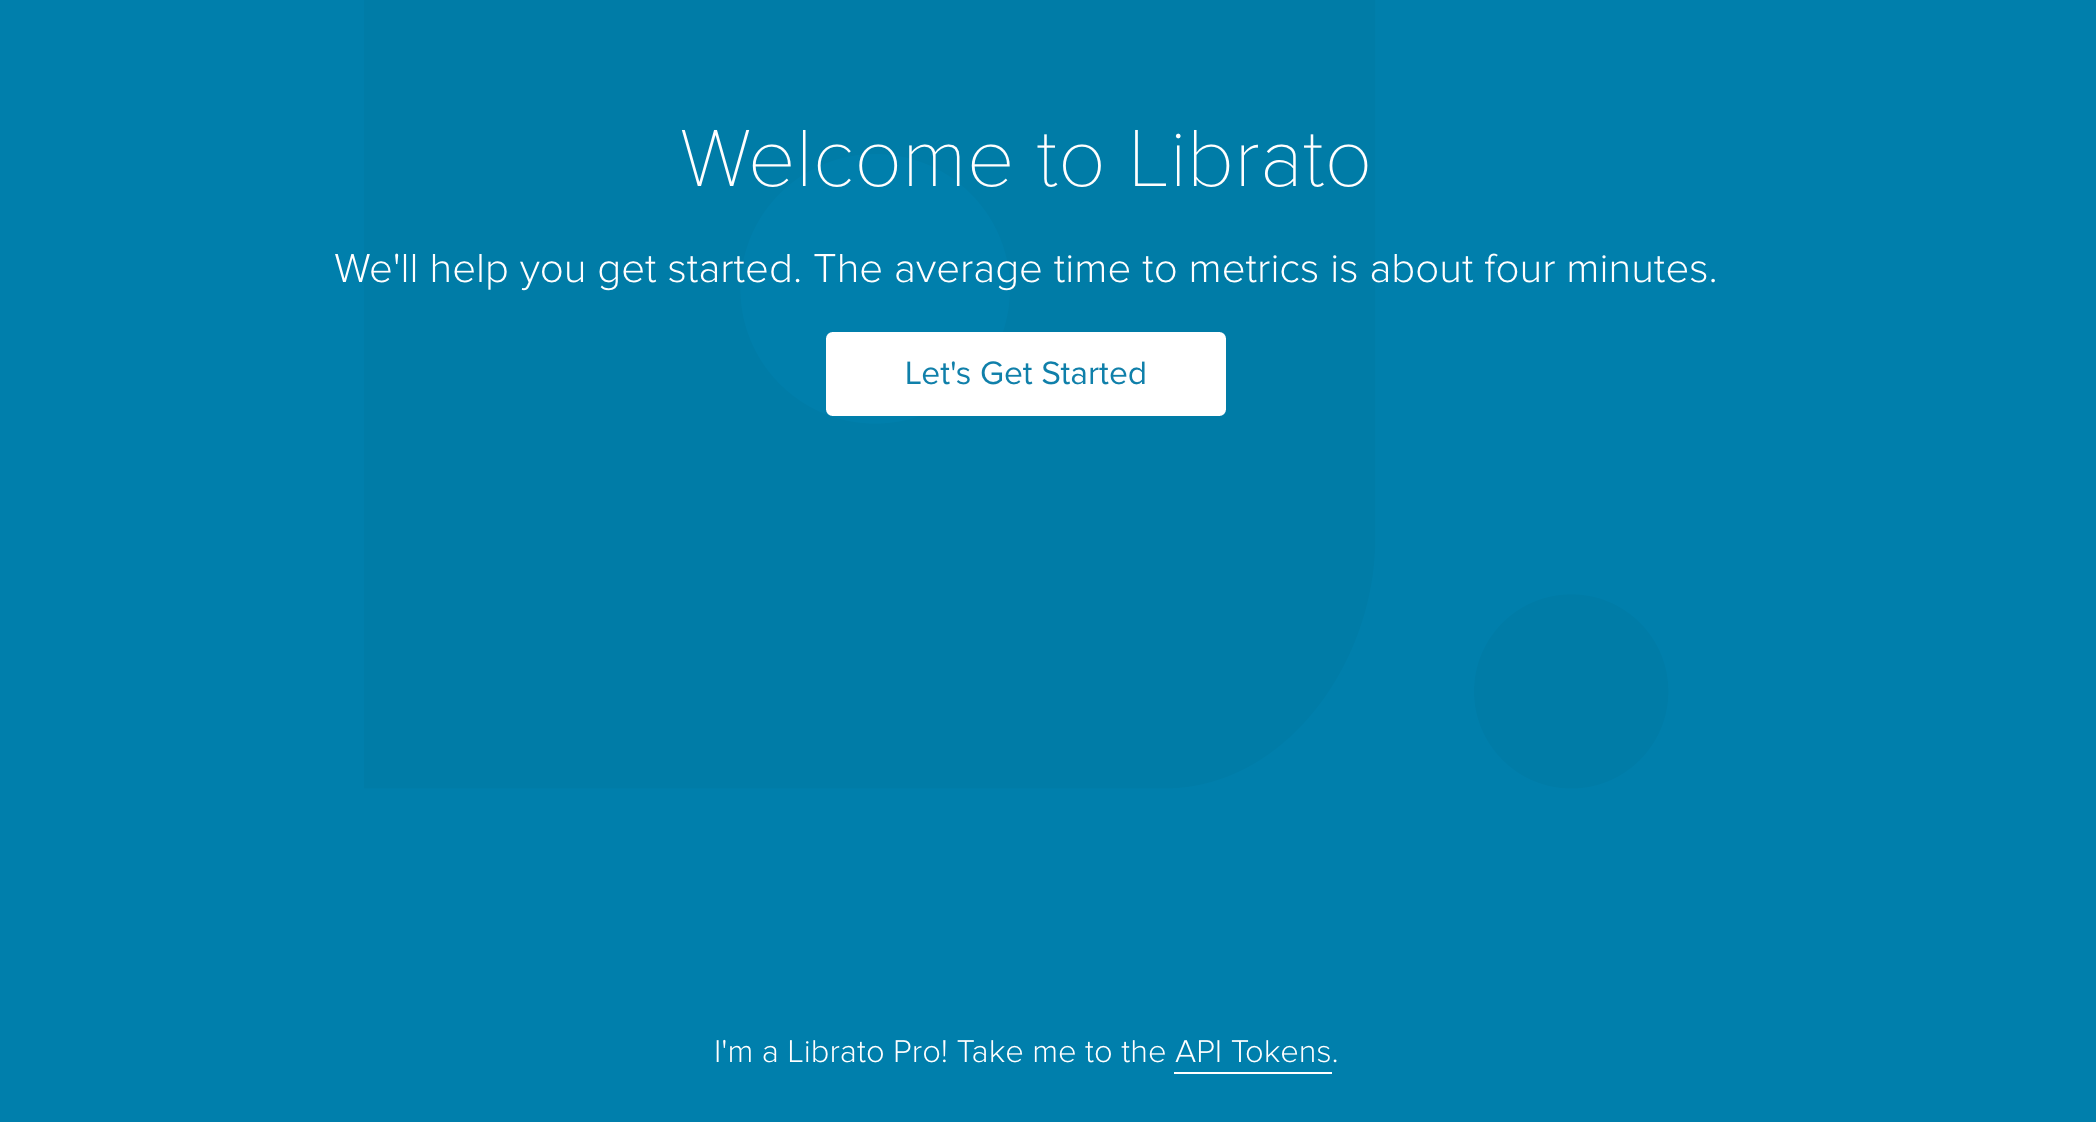
When you first sign up with Librato you will be guided through the setup process. The quickest and easiest way to get started is to use one of the turnkey integrations. These solutions offer the quickest path to get from configuration to curated dashboards for things like server metrics, Docker, Redis, AWS Cloudwatch and many other services.
If you prefer, you can start by sending metrics to our RESTful API. On the first screen of the guided tour, click on the “I’m a Librato Pro! Take me to the API Tokens.” link to grab a token.
Getting metrics into Librato
Before you can add data to a chart you need to begin emitting metric data to our API. There are three ways to get data into Librato:
If you choose an integration from the Integrations Catalog you will be guided through the setup.
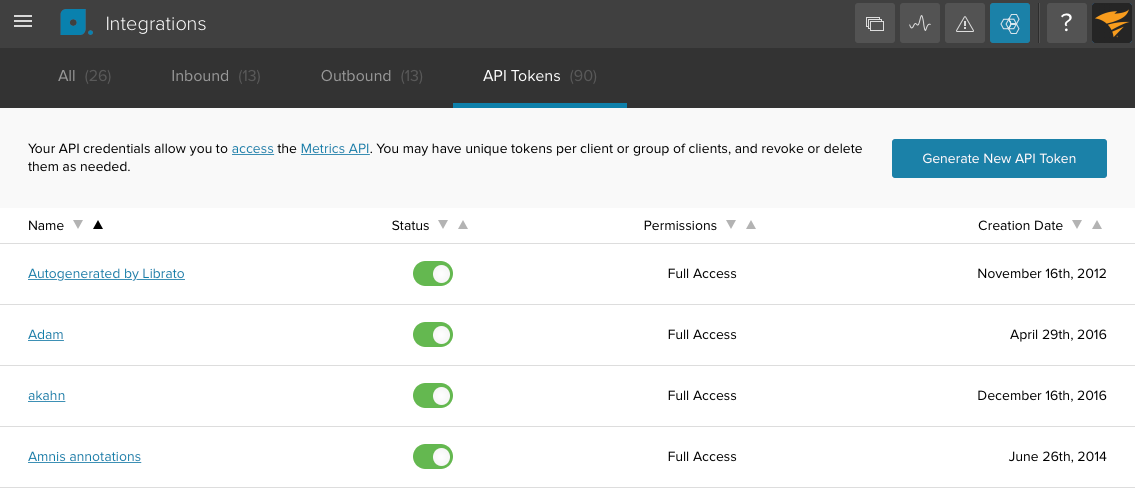
To emit metrics to Librato from any of the large selection of open source collection agents or from any popular programming language via a native language binding, you will need to grab a token. You can find existing tokens or create new ones on the Integrations page under the API Tokens submenu.
You’ll find a comprehensive list of agents and bindings on the product page on our marketing site.
To quickly get some metrics into Librato check out the curl script in the How can I test the Librato service? article.
Spaces
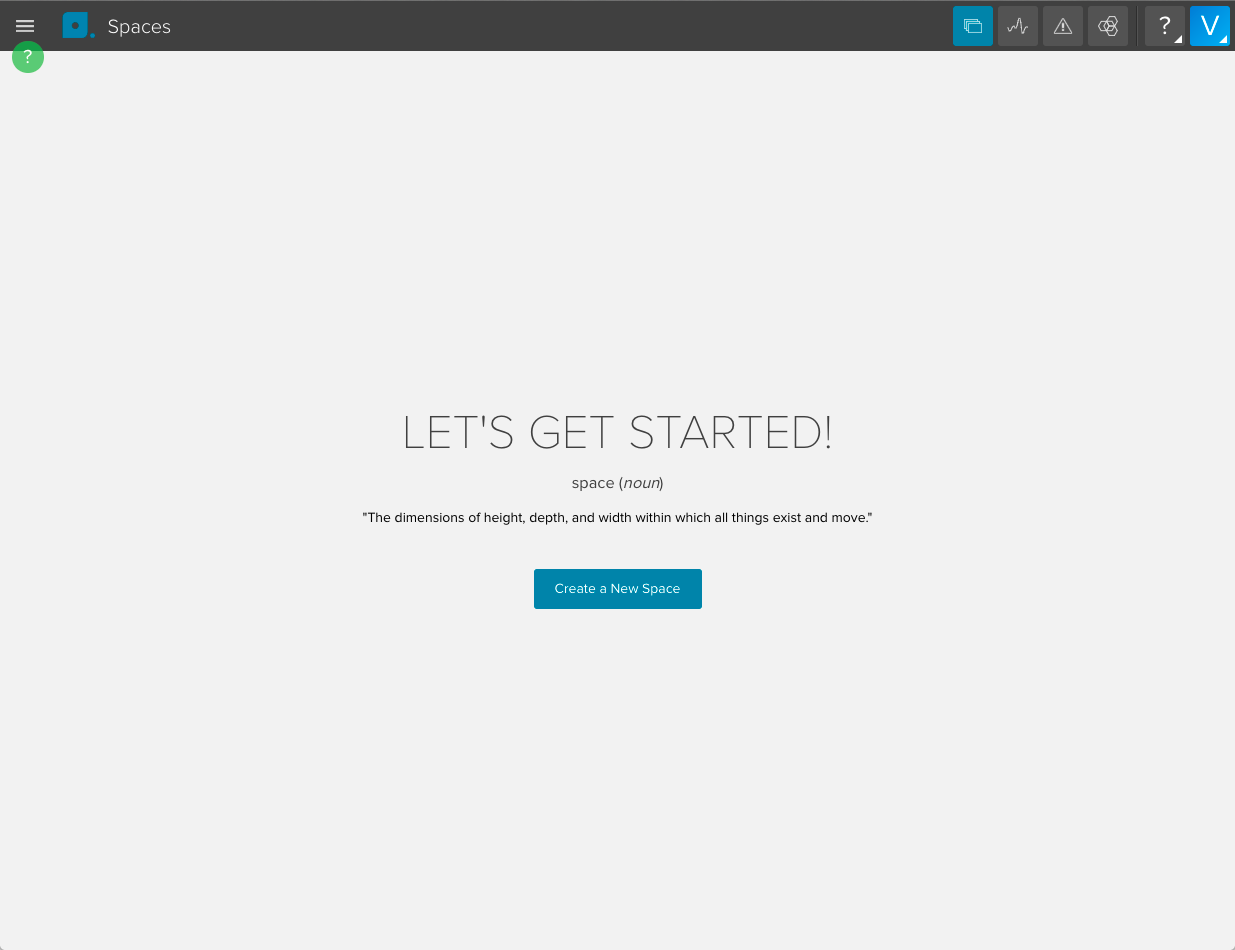
Spaces is our primary user interface. You can create as many Spaces as you want, and use them to present charts that depict related metrics. At Librato, for example, we have a Space for each service that we run in our micro-services infrastructure. All charts in a space automatically refresh, and mousing over a chart will pop-up a tool-tip legend and cursor-tracking line, which makes it easy to correlate events and data across every chart in the space.
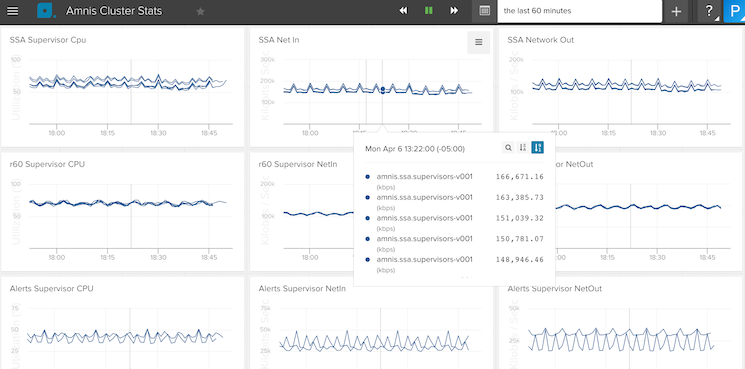
At the top of the space you’ll notice a date-range selector and rwd/pause/fwd buttons which you can use to explore back in time, or pause the charts at a particular day/time range.

Charts
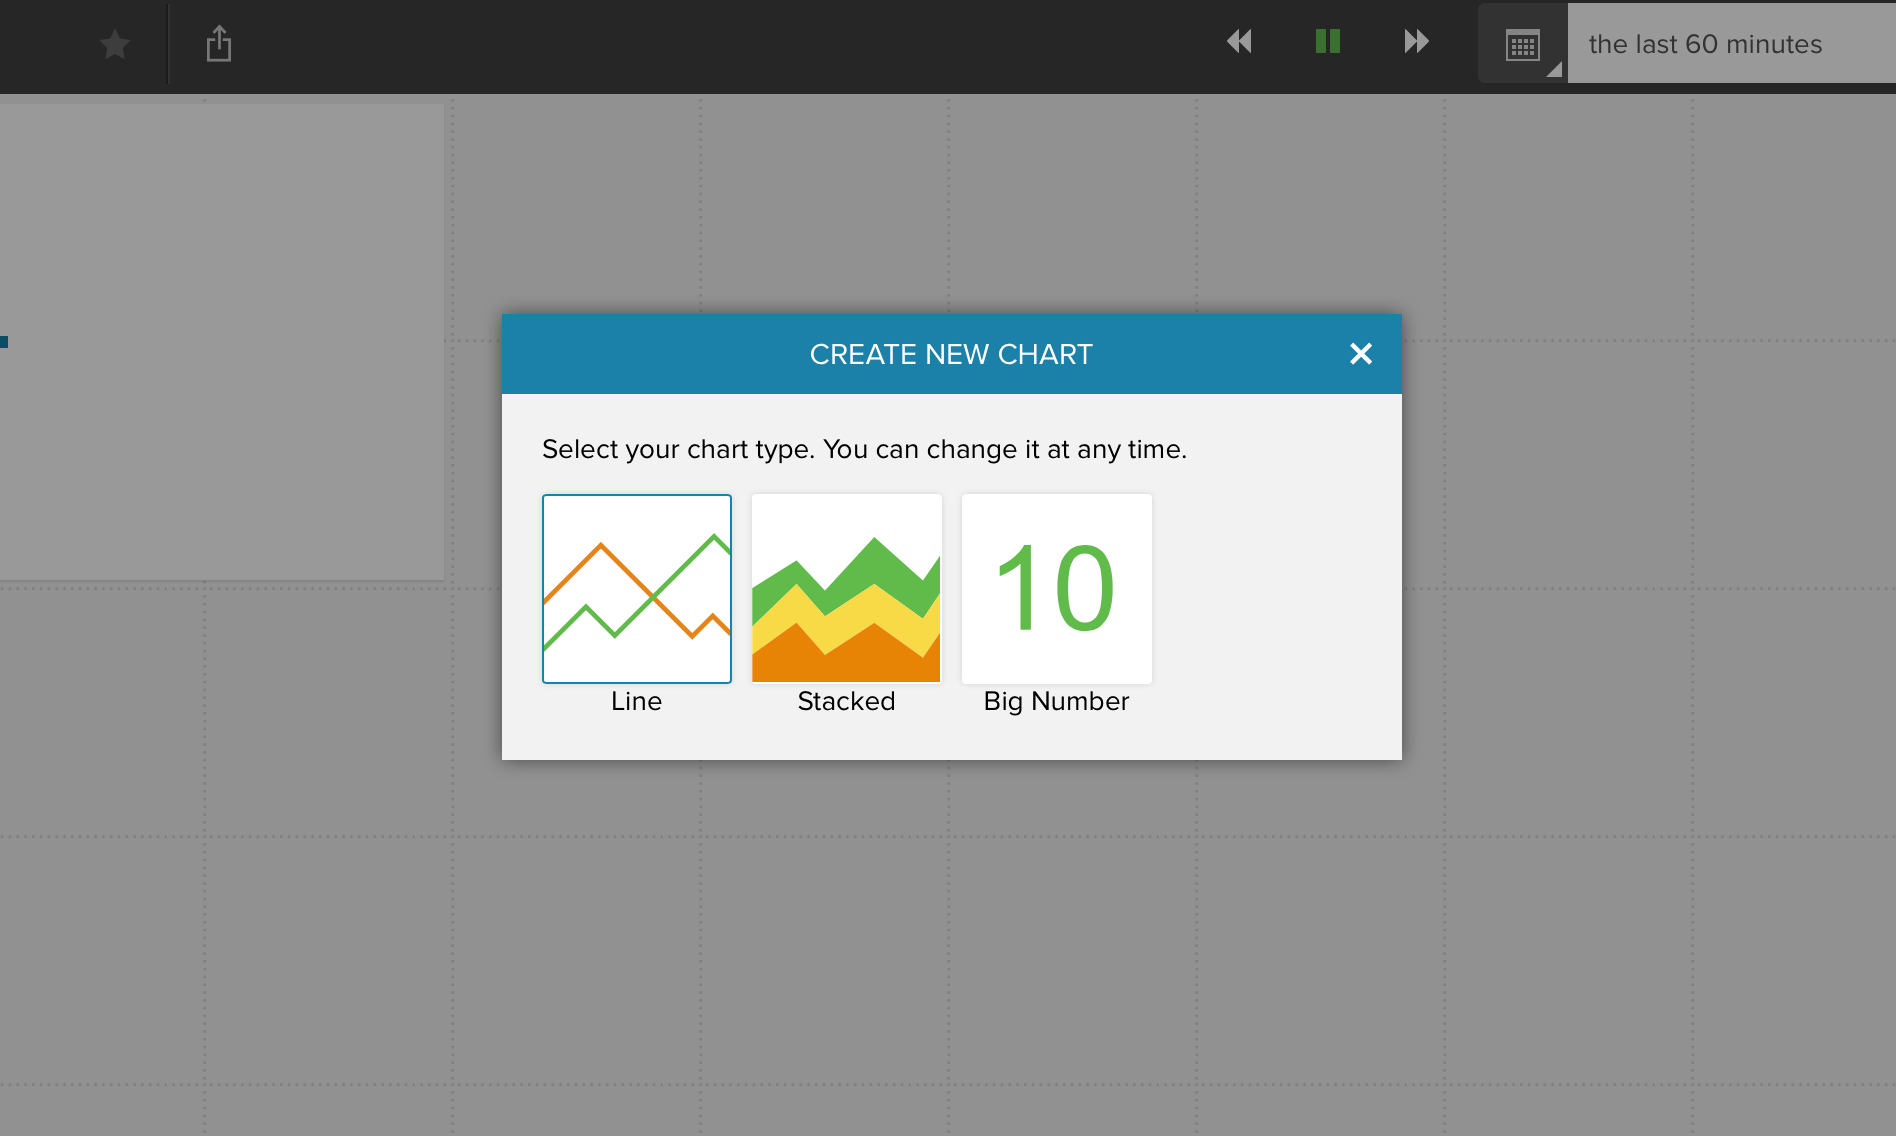
To add a new chart to a Space, click the plus sign in the upper right-hand corner, and select the type of chart you’d like to add (Don’t worry, you can change the chart type later).
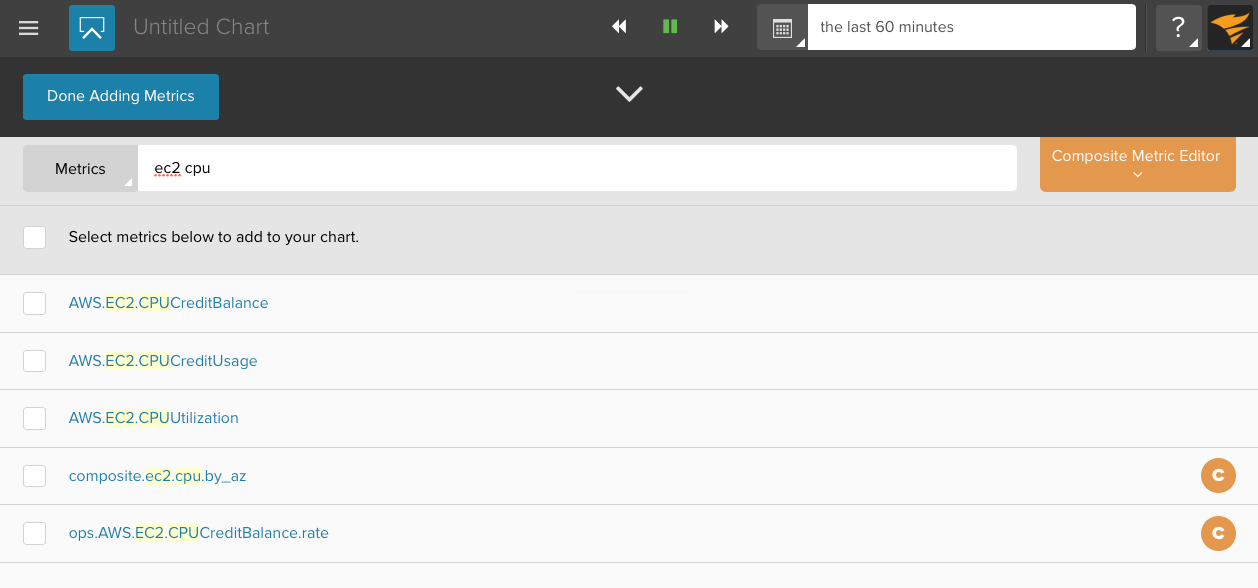
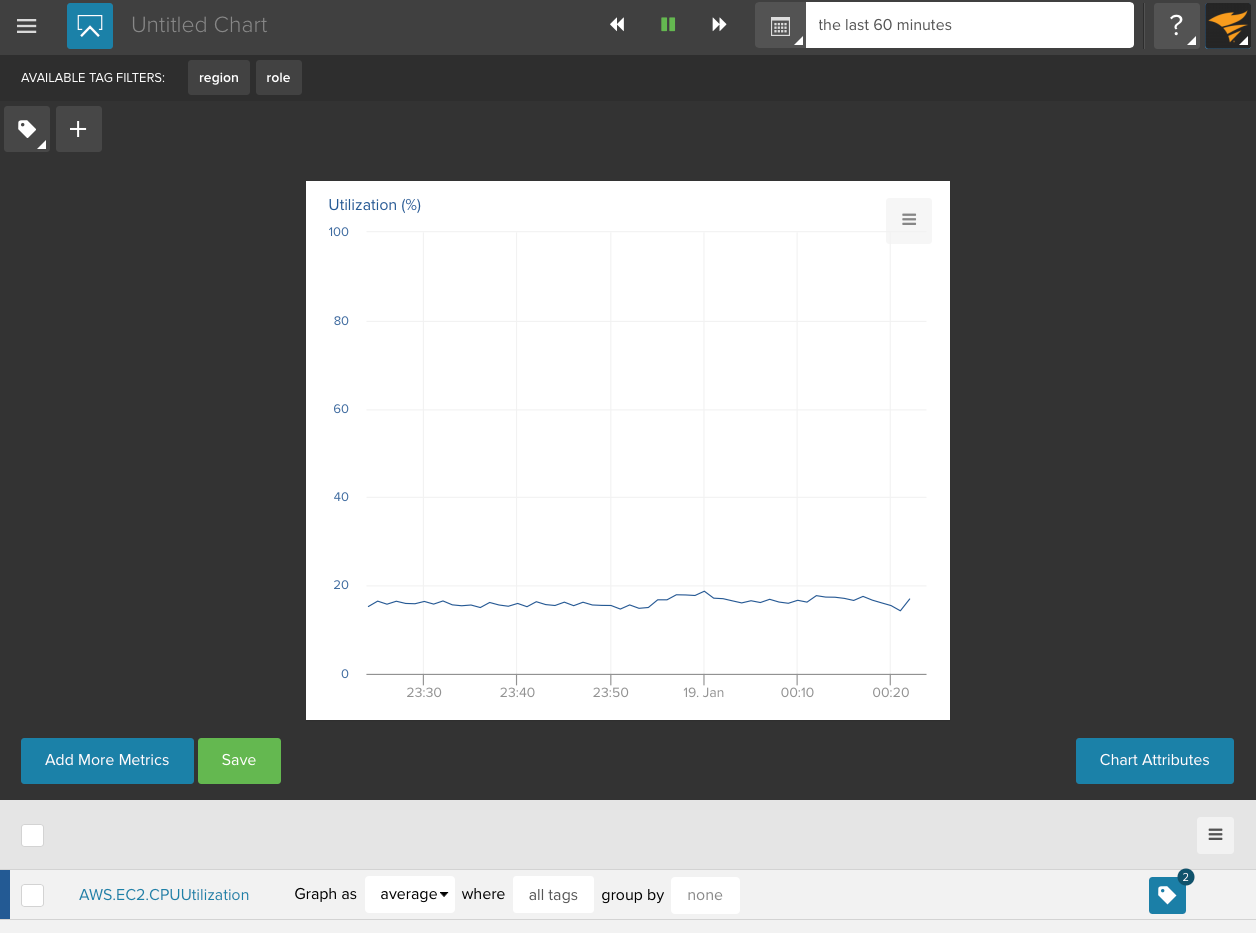
A few seconds after you send a measurement to our API, the metric will appear in the metrics list in the chart editor. Simply check it to add it to the chart.
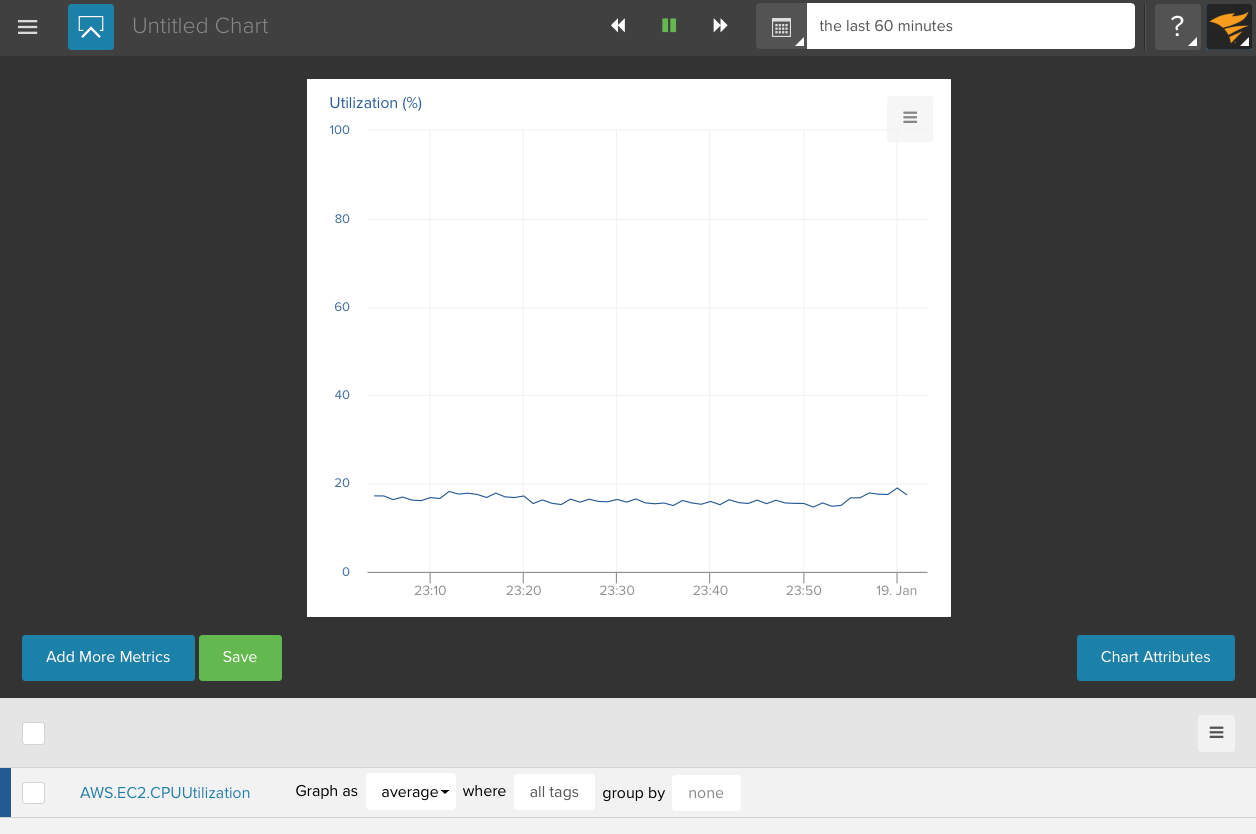
When you first add the metric to a chart, it’ll default to displaying the average across all the data streams that are reporting for that particular metric. You can filter the data by tag and also group on tags which will result in individual data stream for each tag value:
In the following example, the metric is filtered to only show the prodvpc environment
and grouped by instancetype:
You can set tags to be dynamic meaning the tag key is displayed in the header of the Space. This allows you to pick values that affect every chart that has metrics that use that tag AND the tag is set to dynamic on that metric at the chart level.
In the example below, two tags are set to be dynamic: ‘region’ and ‘role’. You set them to dynamic by clicking on the tag icon on the right of the stream composition row and by selecting the desired tag.
Metrics and Tags
Librato’s notion of a metric might be a little different than what you may be used to. The metric name refers to the variable you are measuring, like CPU Load, or Thread Count. Tags add more context, for instance they can describe the instance you are taking the measurement from, like Server Name, and/or the name of the Application or Service. Separated from the metric name, tags provide very powerful filtering and grouping capabilities tool which allow for unprecedented flexibility in displaying your data.
Alerts
We believe that Alerts are a fundamental component of a monitoring service. You can create alerts for any metric you send to Librato.
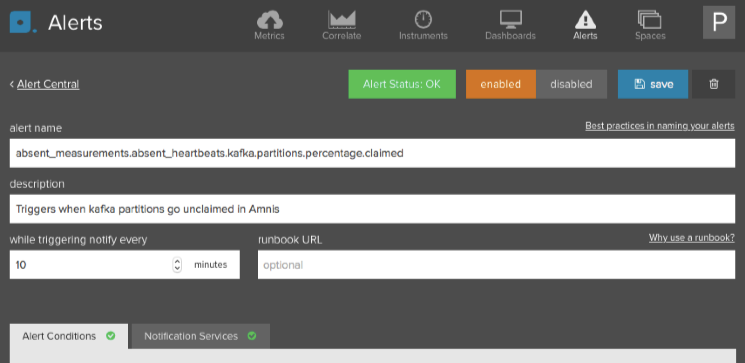
For each alert you set up we create an annotation
stream with the alert name prefixed with librato. That way you can place annotations
on any chart or overlay them over any metric.
Bookmarking and Sharing
Our URI’s always include unique query parameters i.e. tag_set,
duration, and (in the case of custom date ranges) end_time, which
makes it easy to bookmark your favorite Spaces, and craft links that
specify specific date ranges et al. If you want to share a chart or
space with a collaborator
just send them the URI and they will see exactly what you see.
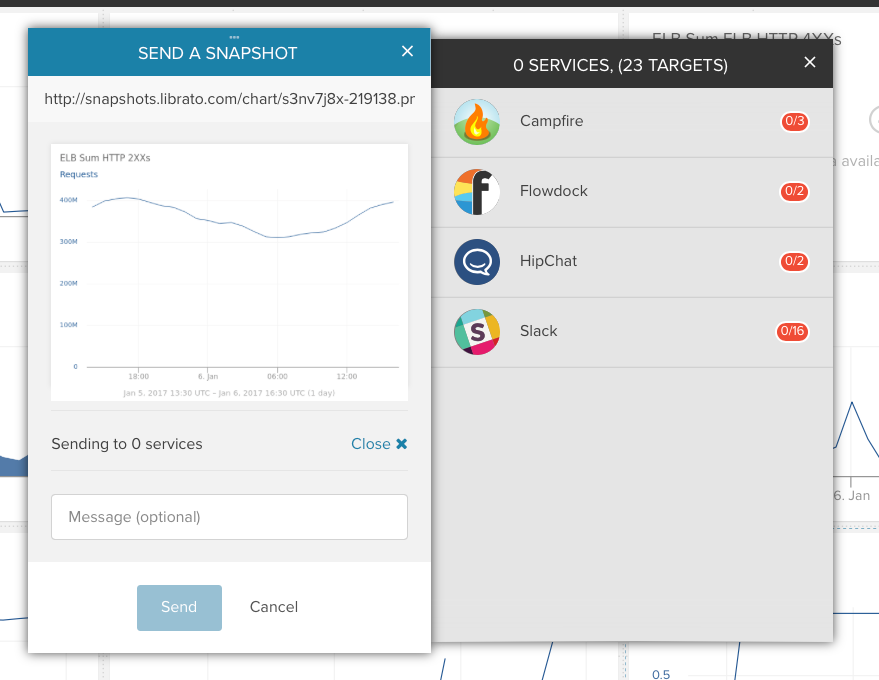
If you want to share a chart with an external entity, or embed a chart in a chat service like Slack, you can use our snapshot feature, which allows you to seamlessly snapshot and send straight from the Librato app.