
NGINX
![]()
NGINX is an open source web server with a strong focus on high concurrency, performance and low memory usage. It’s one of the most popular web servers on the internet, and can also act as a reverse proxy, a load balancer, or as an HTTP cache.
The Librato Agent allows you to easily monitor the health
of your NGINX service(s). We use collectd’s nginx plugin to gather
metrics from the running NGINX server. It requires that your nginx
binary is compiled with the stub_status
module
enabled.
Note: This plugin only supports the gathering of metrics from the open source NGINX web server. It does not support the commercial NGINX Plus server. We may offer support for that service at some point in the future.
Installation
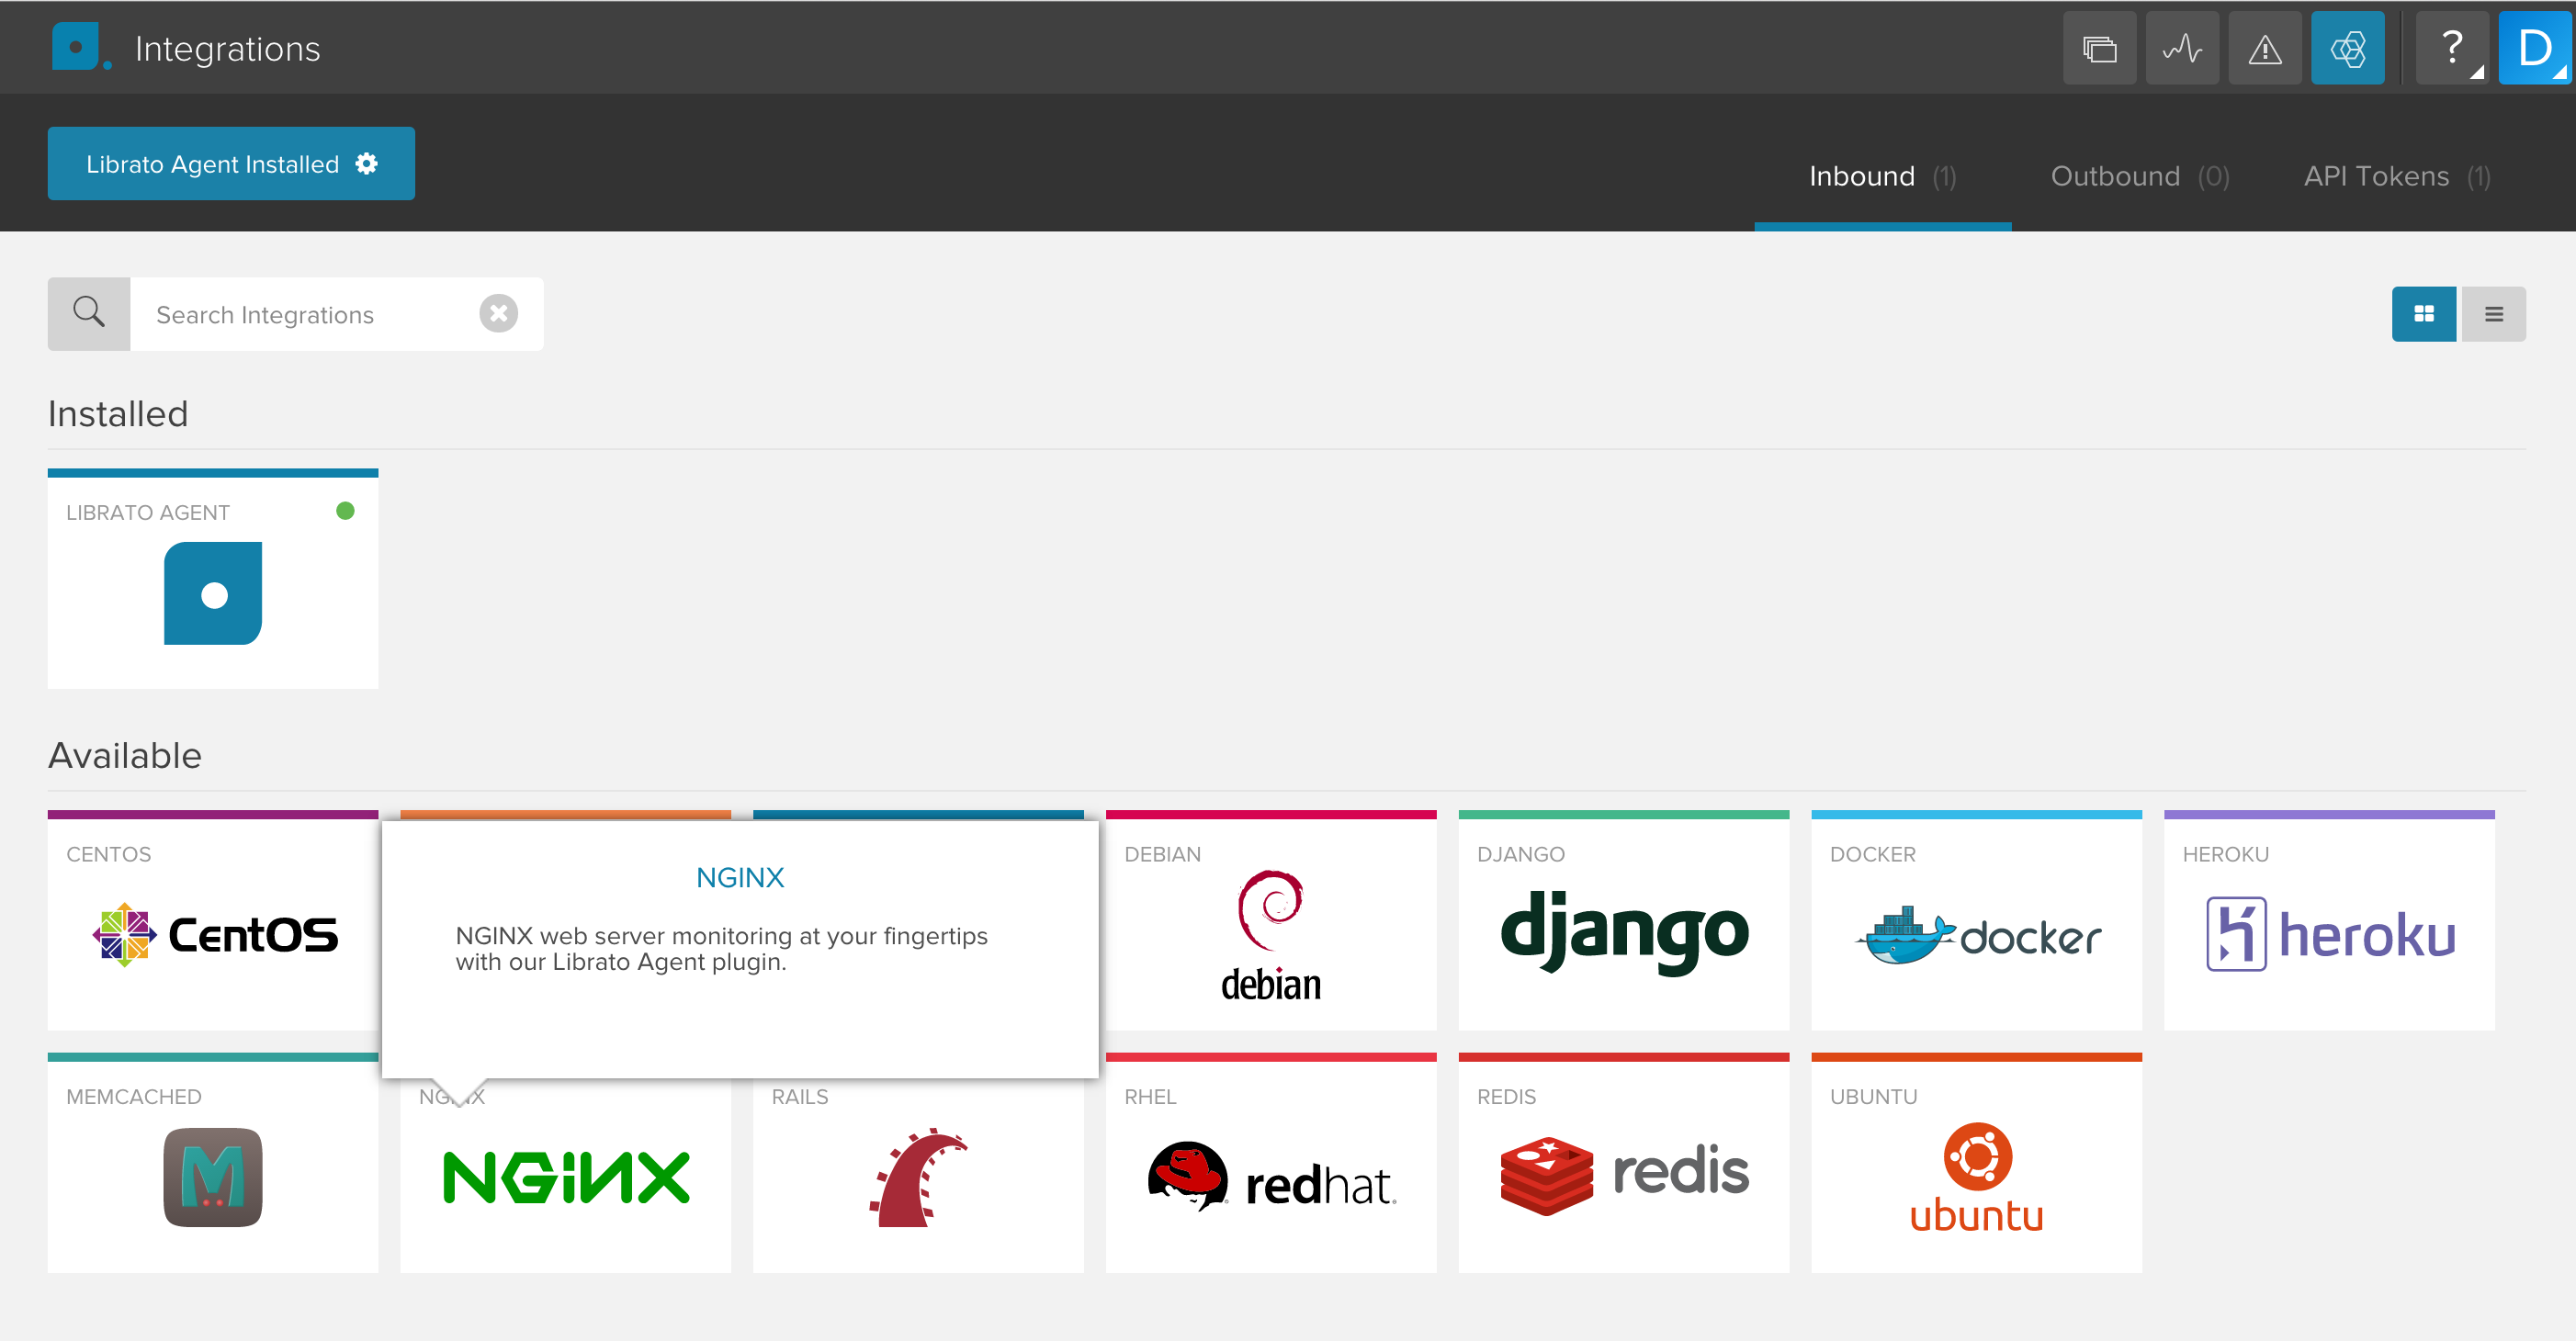
The NGINX integration depends on the Librato Agent. If you haven’t already, you will first need to install the Librato Agent. Once this is complete, select the NGINX icon in the integrations catalogue.
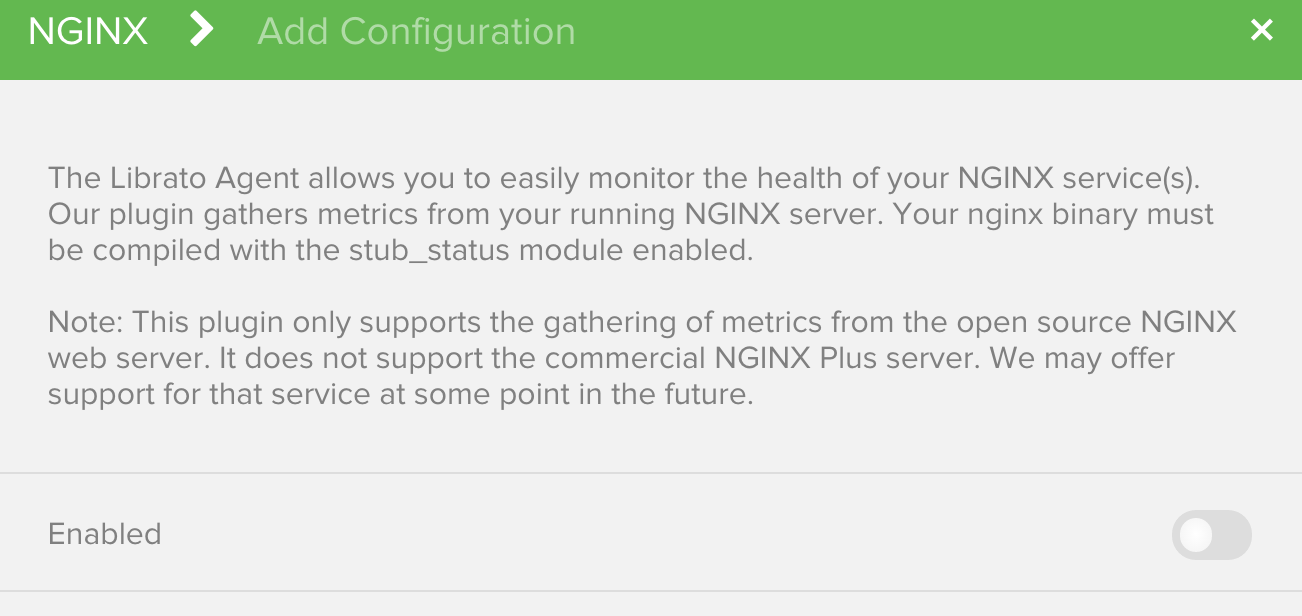
Toggle the Enabled switch to activate the NGINX integration on your Librato account and create the preconfigured NGINX Space.
At this point your integration is complete and any NGINX metrics associated with this integration will be allowed through your Librato Agent service-side filters.
Plugin Configuration
The NGINX server being monitored must have the stub\_status module
compiled into its binary. Most distributions have this enabled by
default. This can be verified with the following command:
$ nginx -V 2>&1 | grep -o with-http_stub_status_module
Your NGINX server will need a location defined with the
stub_status module activated. Here is a sample definition that
allows connections from the local agent and works with our default
plugin configuration.
server {
    location /basic_status {
        stub_status on;
        access_log off;
        allow 127.0.0.1;
        deny all;
    }
}
Alternatively, you can adjust the URL setting in the
/opt/collectd/etc/collectd.conf.d/nginx.conf configuration file to
match your particular setup.
LoadPlugin nginx
<Plugin nginx>
  URL "http://127.0.0.1/basic_status"
</Plugin>
Note: You must restart the agent after any changes to your Librato Agent configuration files.
$ sudo service collectd restart
At this point you should begin seeing librato.nginx.* metrics
in your Librato account.
NGINX Workspace
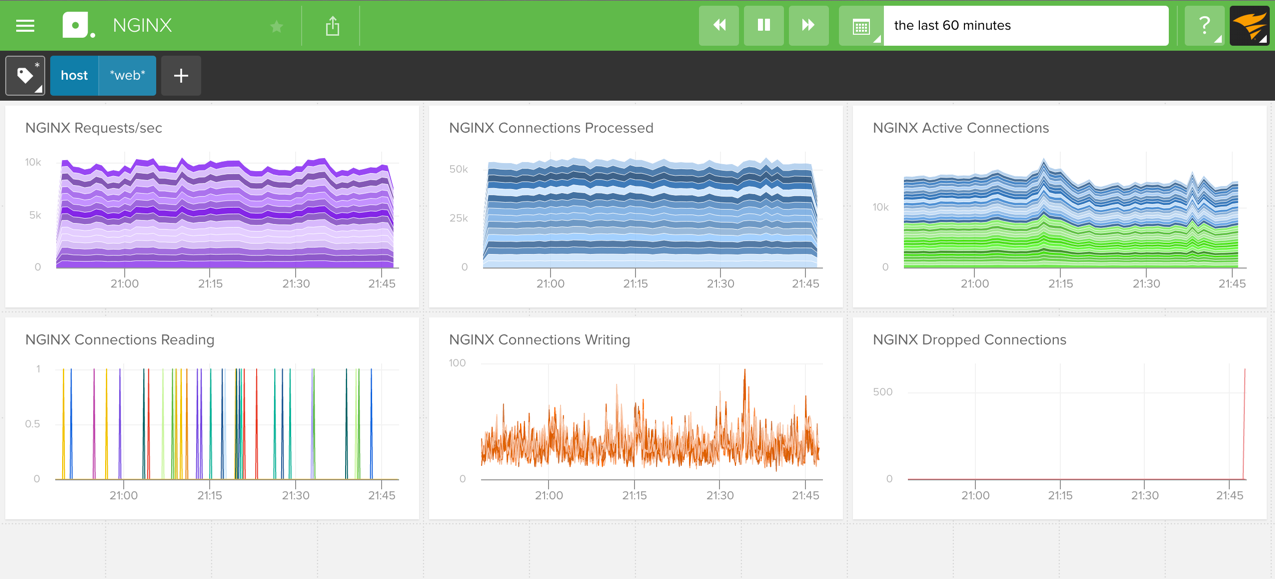
Visit your preconfigured Space to observe your new metrics as they stream in. You can use our dynamic source field at the top to filter your view to a subset of metric sources. For example, you may want to isolate the view to a specific tier of web servers or even to an individual machine that is behaving badly.
NGINX Metrics and tags
The NGINX integration supports the following metrics and tags.
Note: All metrics are prefixed with librato.nginx..
| Tag Name | Description |
|---|---|
| host | Host name or IP address of monitored server |
Requests
| Description | Name | Tags |
|---|---|---|
| Total number of client requests | requests | host |
| Number of connections where nginx is reading the request header | requests.reading | host |
| Number of connections where nginx is writing the response to the client | requests.writing | host |
| Number of idle connections waiting for a request | requests.waiting | host |
| Number of active client connections including waiting connections | requests.active | host |
Connection statistics
| Description | Name | Tags |
|---|---|---|
| Total number of accepted client connections | connections.accepted | host |
| Total number of handled connections | connections.handled | host |
| Percentage of connections that were dropped | connections.pct_dropped | host |
FAQ
For specific answers to Librato Agent questions check out our Librato Agent FAQ.
Please let us know what you think about this integration. We would love to incorporate your feedback and any ideas you have on dashboard design into the ongoing development of our integrations.