
Spaces
Spaces was designed to easily create and display elegant arrangements of related data. Spaces is grid-based so you can place and resize individual charts by dragging them around and adjusting their resize-corners. If you resize the browser window, your charts will resize themselves to preserve their relative sizes and locations.
When you log in to Librato you land on the Spaces page. It lists all the available Spaces and highlights the recently used and favorite Spaces.
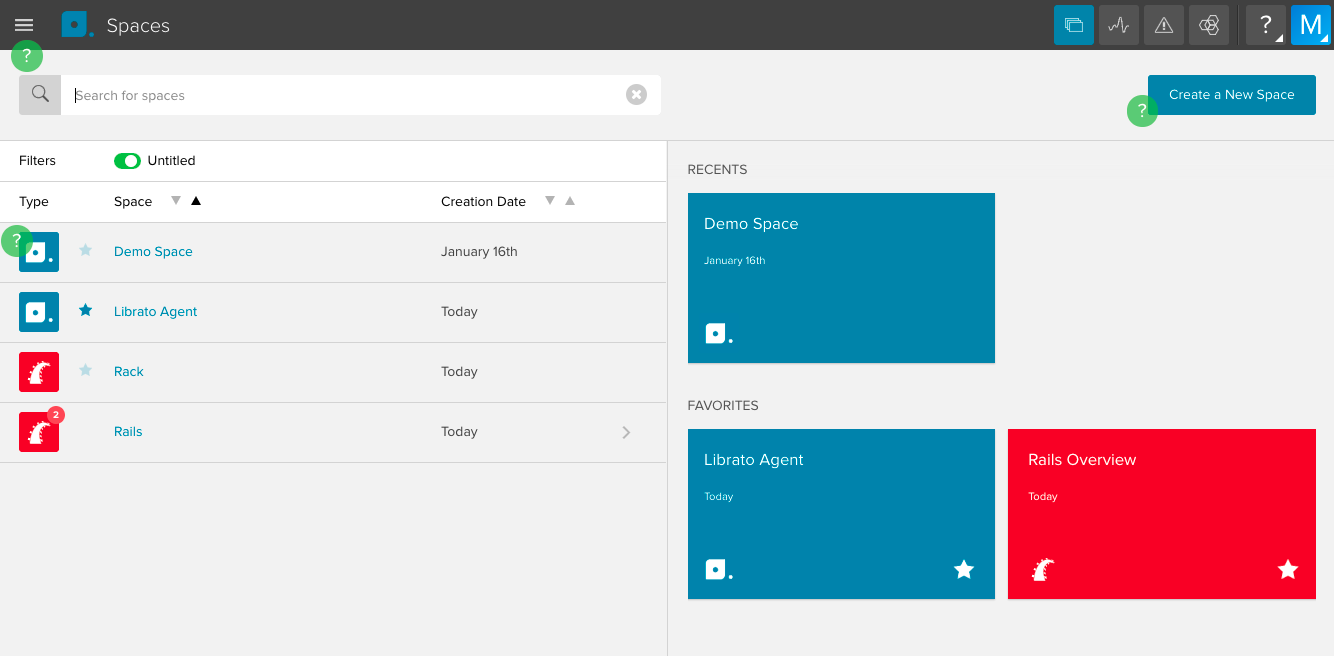
You can favorite Spaces by clicking on the star next to the Spaces name in the list. When the Space is open there’s a star right next to the name in the menu bar as well.
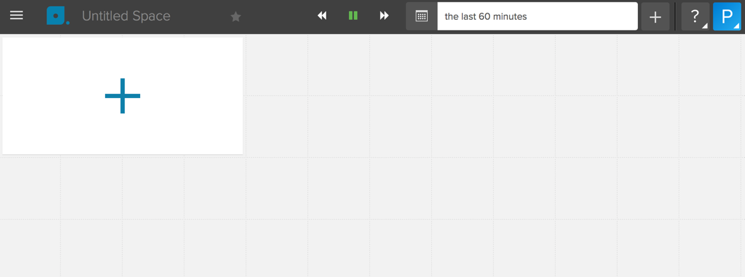
Clicking on “Create a New Space” creates a blank slate with a placeholder for a chart begging you to click on the big plus sign.
In Spaces, building and editing charts is really fast. Without leaving the Space, you can easily create and modify charts inline. This includes manipulating metrics, annotations, chart axis labels, titles, and more. If you select “Edit Chart” from a chart menu, or add a new chart to your Space by clicking on a [+] symbol, we’ll slide-up the chart editor where you can add or remove streams, and change the stream composition. To dismiss the chart editor, click on the blue up-arrow icon in the top left hand corner of the window.
We think you’ll agree that the new chart-editor is a joy to work with. Quickly filter your available metrics by entering a few keywords, and then check them to add them to the chart. You can also click the orange “Composite Metric Editor” button to create a new metric by performing mathematical transformations on any of the metrics you’re sending us.
Once you’ve added some metrics to the chart, you can use the metric stream check box to select all of them, and set attributes like the display summarization, tag filters, and grouping functions for all metrics at the same time. You can also make tags dynamic, so that they appear in the menu of the Space. The attributes menu – accessed via the hamburger menu icon to the right of each metric – allows you to set per-metric attributes like custom colors, a separate y-axis, and unit labels.
Tool Tips and Cursor Tracking
Mousing-over any chart in the workspace brings up a tool-tip legend and a cursor-tracking line on the chart. The line is mirrored in every chart on the workspace so you can easily correlate data across charts, regardless of relative differences in chart size.
The tool-tip legend provides rich context no matter how many hundreds of streams the chart might depict. You can sort the legend by the highest or lowest value, or alphabetically by name in ascending or descending order. Clicking the magnifying glass in the legend allows you to filter the streams.
Stepping Through Time
All charts auto-refresh with an interval based on the shortest associated metric period. If no periods are set, it should refresh on a 30 second interval. If you want to look at historic data you can either use the date picker or, for more recent events you can step back and forward in time with the << and >> buttons in the menu bar. Clicking on the back button will pause the auto-refresh and move the time window back half the display period. Clicking on play will bring your Space back to real-time and switch auto-refresh back on again.
Copy Spaces
If you want to tweak an existing Space or modify a curated Space (like Heroku or AWS), you can clone Spaces using the share button in the menu bar. Give the copied Space a name, and you’re good to go.
On the Spaces index page, you will find “Copy Space” in the drop down menu, both on the Space rows and Recents/Favorites cards. You may optionally check the “Open Space on completion” box to conveniently navigate to the copied Space after it has been generated.
The copied Space contains all of your charts and streams organized the same way as the original Space. It is important to note that charts within the copied Space are copies: updating charts or chart layout in the copied Space will not affect charts or chart layout of the original Space.