How to create a stacked graph
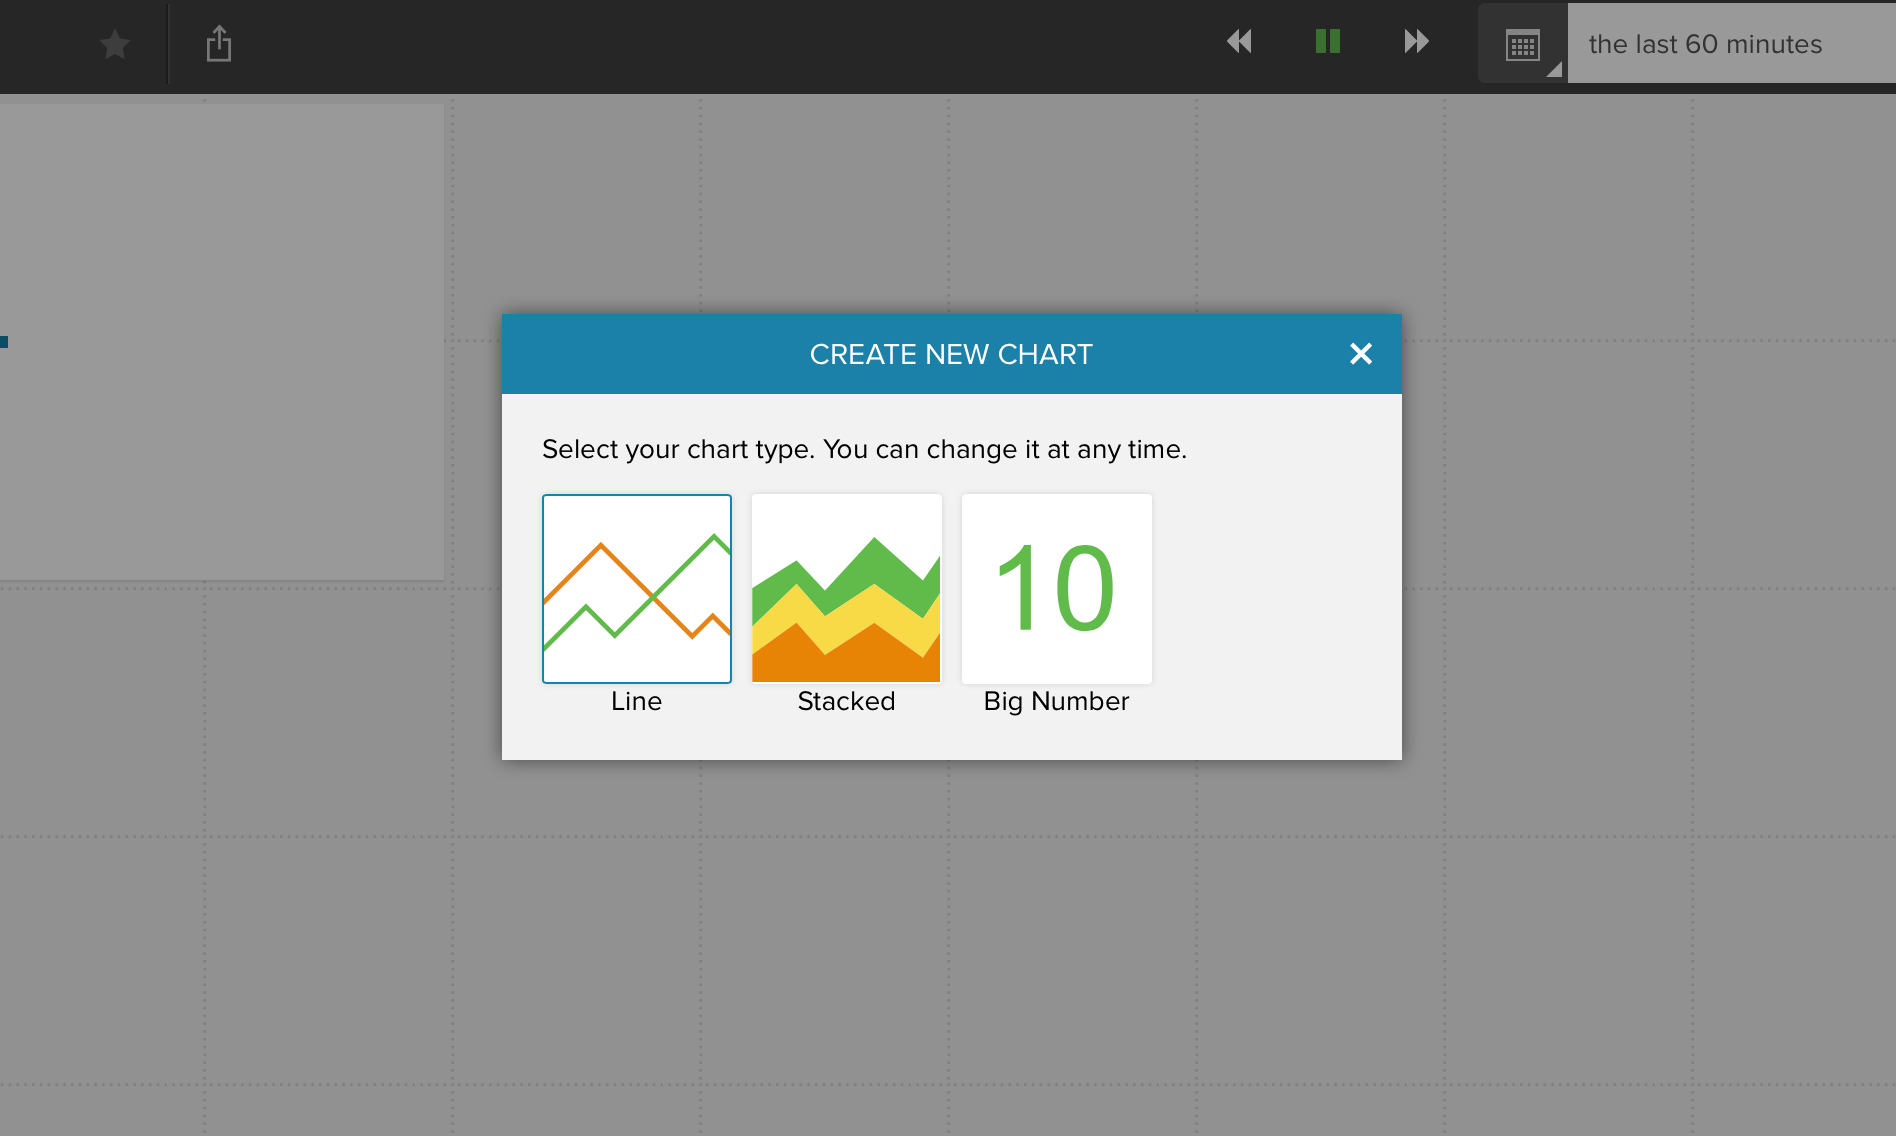
To create a stacked graph, start on a Space (new or existing) and click on the plus in the menu bar. In the modal that pops up select “Stacked”.
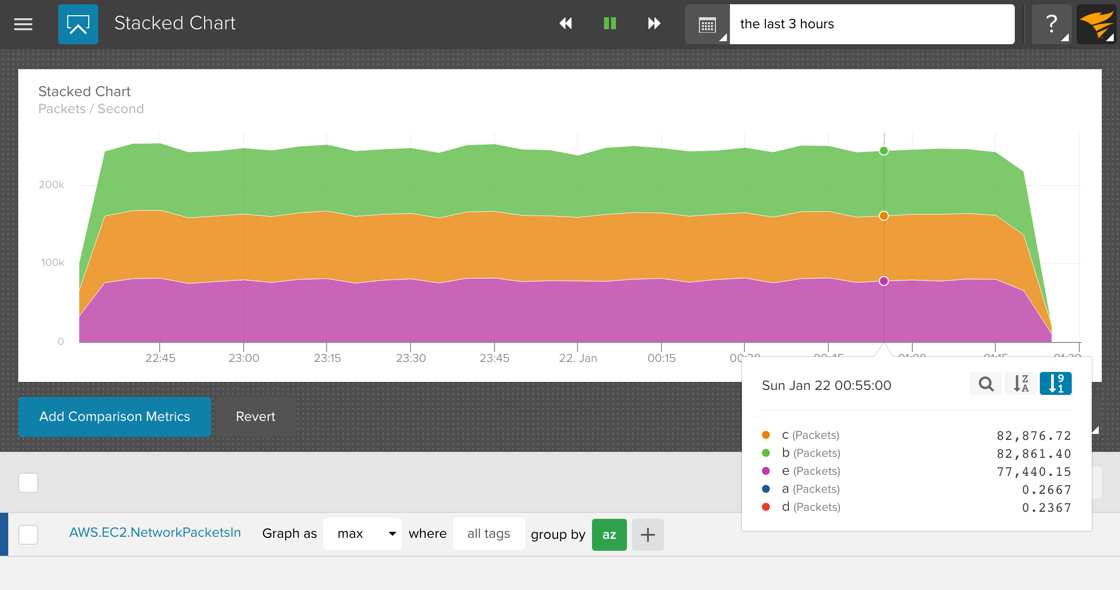
When you add a single metric it will show as an area chart. If you add multiple metrics they will stack. You can also add a single metric with multiple streams, then group by a tag, and each data stream for that metric will be stacked.
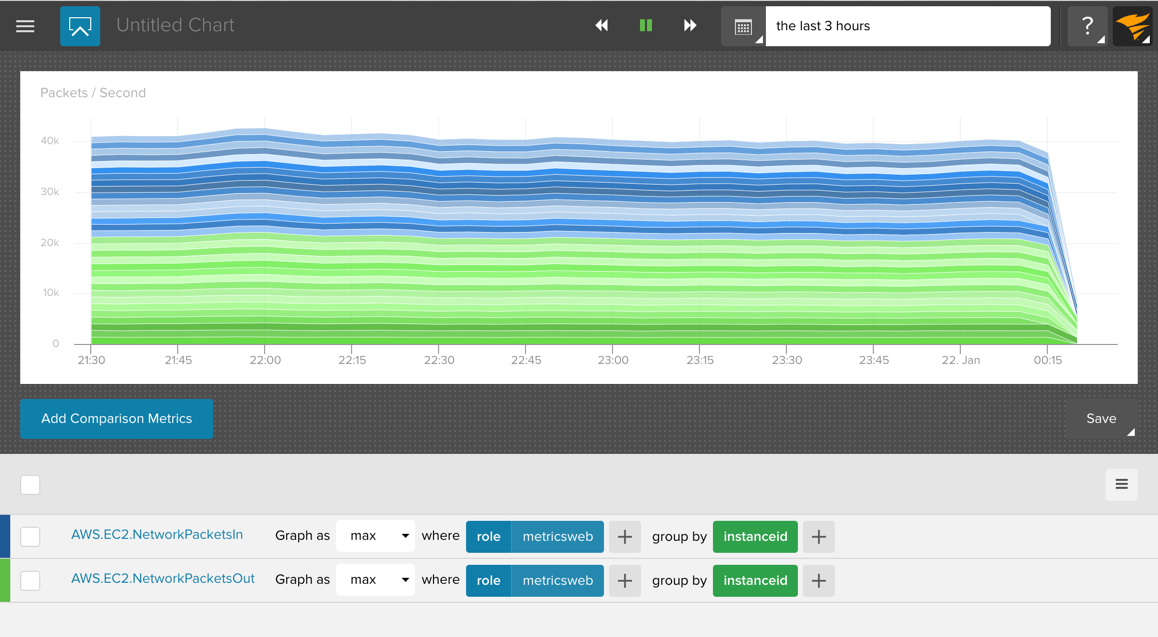
If you add two metrics that each have multiple streams we will try to use shades of the same color to differentiate the metrics - that only works well with reasonable amounts of streams though.
If you add a series to an existing chart, the series will be added at the bottom of the chart.