Dynamic Tags
When creating charts (and by extension Spaces) you generally specify a metric and the associated tags. You may have a scenario where you will want to apply the same curated set of visualizations across several homogeneous tags. While wildcard tags provide some flexibility, dynamic tags solve that in a much more elegant way.
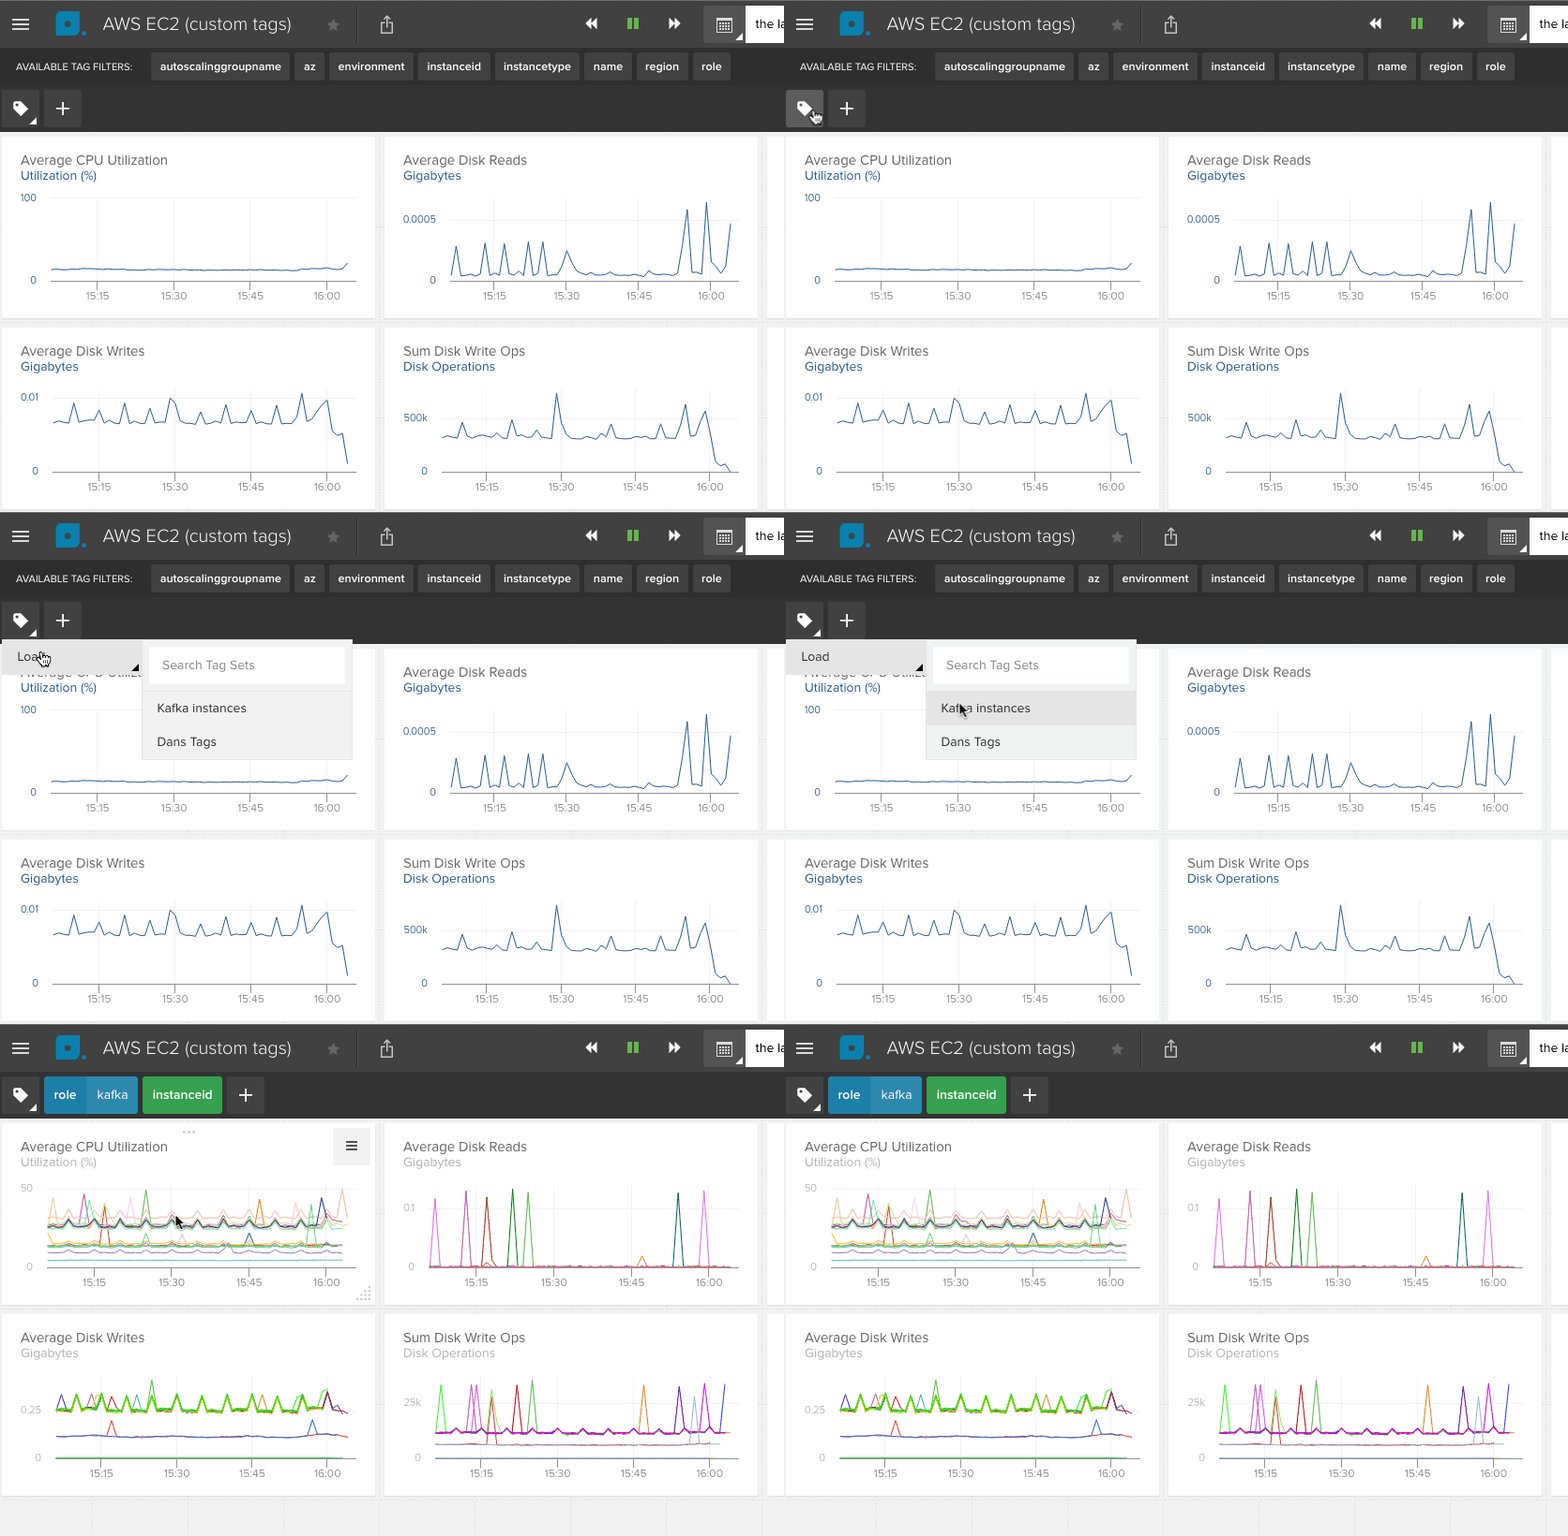
With the Dynamic Tag bar you can dynamically modify the tag(s) being visualized in all dynamic charts within the same space.
When you edit a chart, you can specify the tags associated with the metric or annotation which you want to add to the tag bar. Click on tag icon to the right of each metric and select any tag(s) you wish to add to the tag bar. At least 1 tag must be selected in order for the chart to be dynamic.
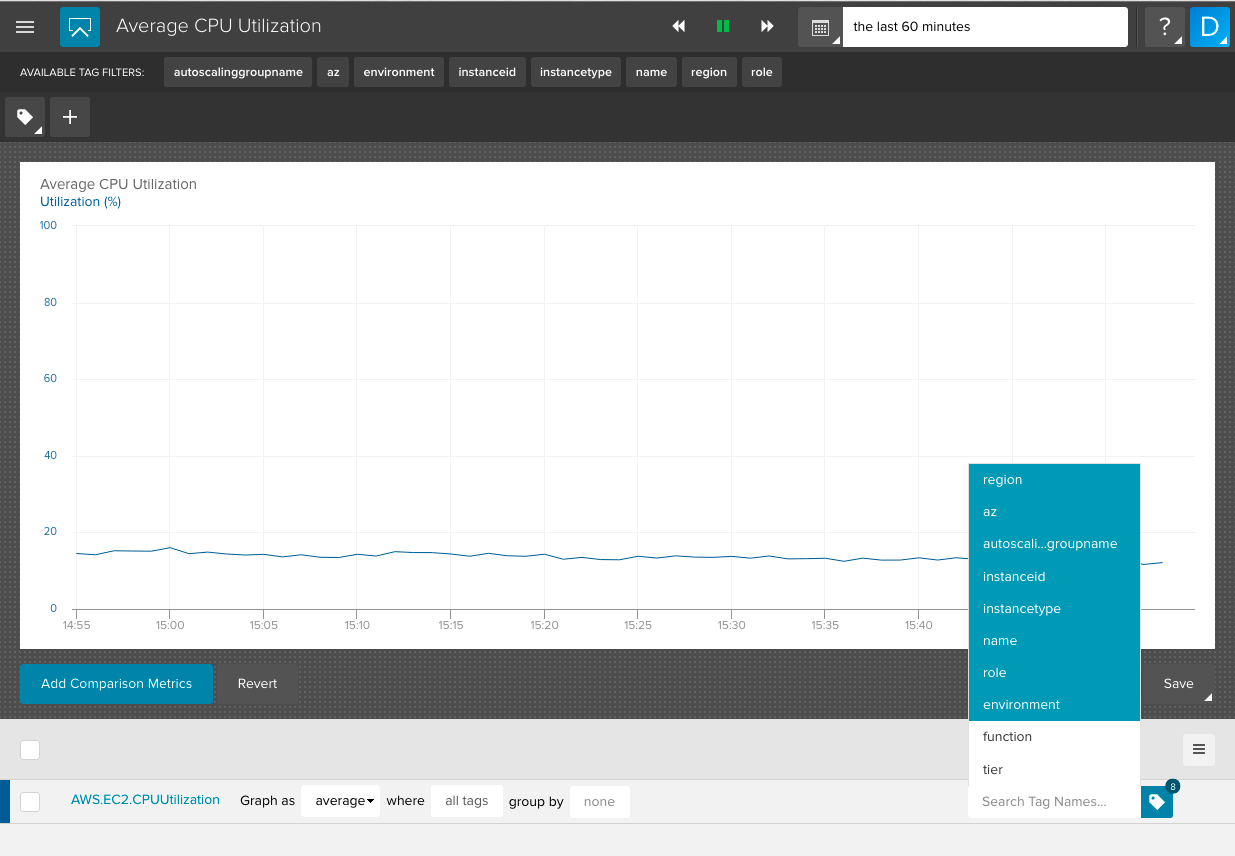
A tag bar will appear in the header of the page that allows you to select one or many tags, along with an associated value. Immediately after specifying a tag/value combination the graph will render with the tag(s) you specify.
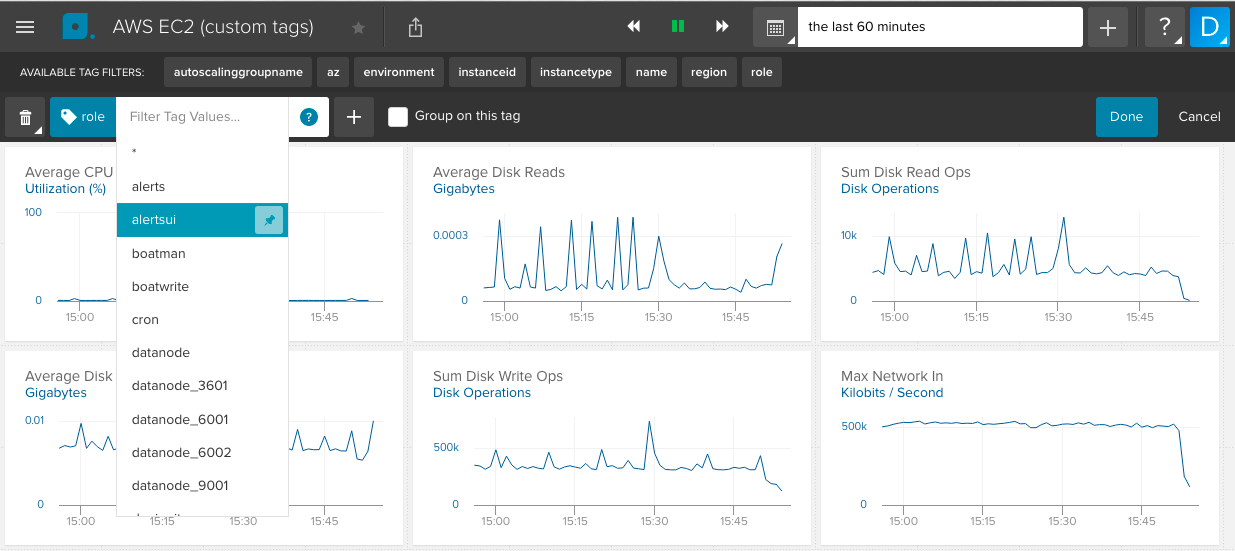
The tag bar allows you to select one or multiple values per tag, and up to 50 unique tags without modifying the underlying chart resource. Click the pin icon next to each value you wish to include in your dynamic tag set. Select the wilcard * character in order to include all values associated with a tag.
Filtering
Tags allow you to filter down into the detail that you want to see. When you first
look at your data, you will see an aggregate across all data streams which results
in one line on a chart. As an example, at Librato, we run many services on AWS.
Each micro service has a cluster of EC2 instances associated with it. If I look at the
AWS EC2 CPUUtilization chart, I can see the average CPU Utilization across all instances.
Using the filter function, I can dynamically filter down into one specific service. In
the example below, I clicked on the role tag and selected alerts. The chart is
now showing AWS EC2 CPUUtilization for my alerts service.
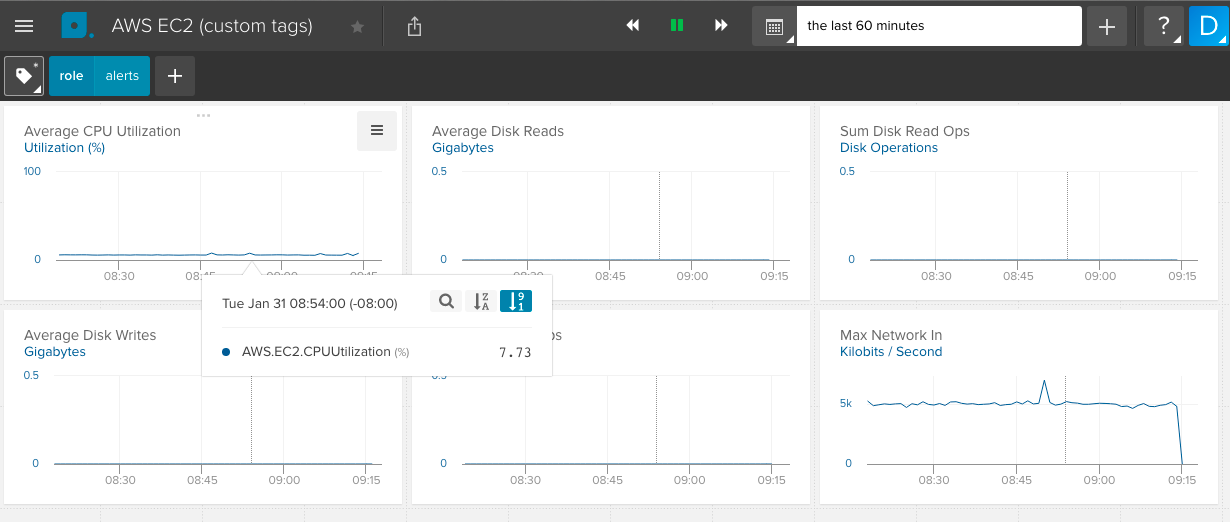
Tag filters are shown in blue.
Grouping
Grouping is the act of aggregating data streams across unique tag values. This allows you to ‘break out’ a chart by a tag’s individual values. Continuing with the example above, to
see the CPU Utilization at the instance level, all I need to do is add the instanceid tag
and select ‘Group on this tag’.
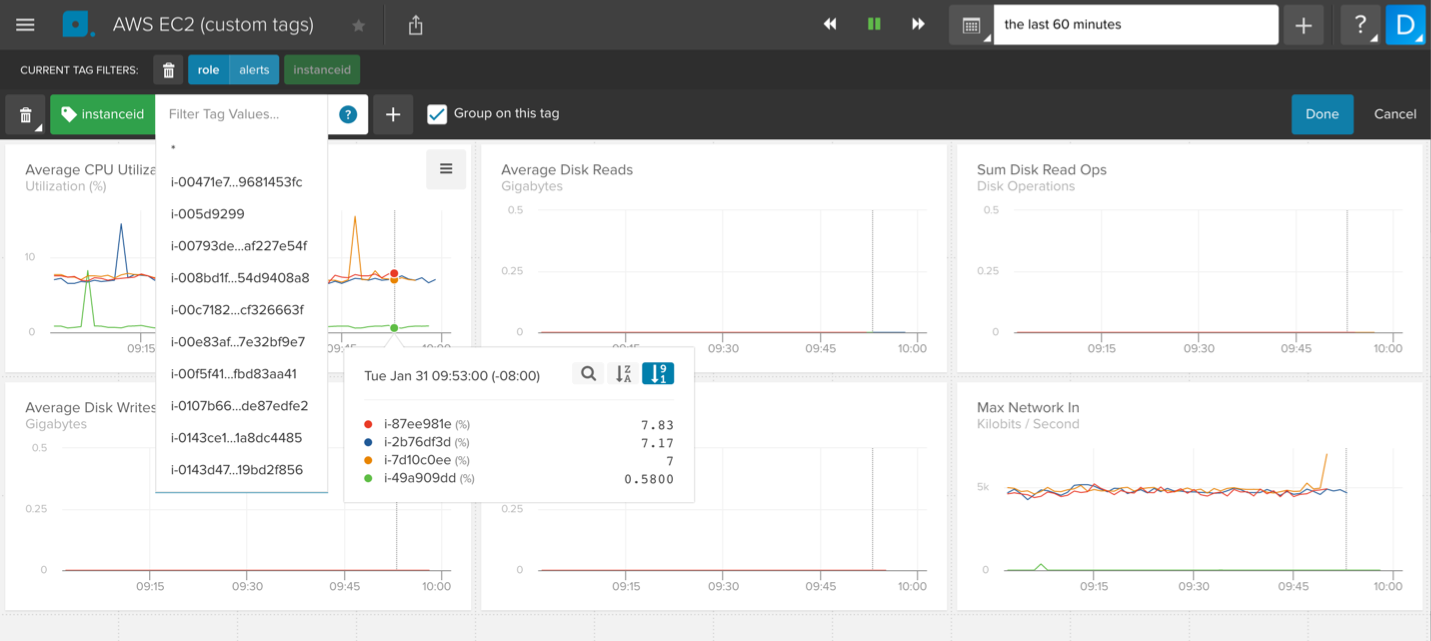
Now, the chart shows one line per instance id.
Grouped tags are shown in green.
Saving Tag Sets
You can save your tag configuration by navigating to the tag icon in the header and selecting Save. When saving, provide the configuration with a name and specify if the configuration should only be available on the Space level or the account level (everywhere). You can also specify whether the tag set is editable only by you or everyone on your team.
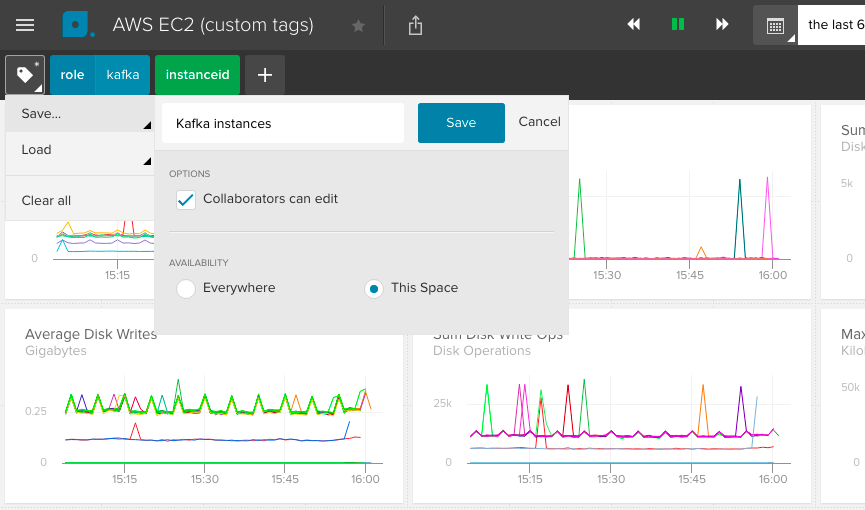
After a tag set has been saved you can load it on the same Space, or any Space if the tag set was saved for everywhere.
