
Simple math on graphs (aka display transform)
The display transform allows you to transform the graph based on a simple formula. For example if you are measuring temperature via a sensor you can use the simple display transform to convert the graph from Fahrenheit to Celsius by entering (x-32)/1.8 into the display transform field. Permitted variables are x (data point) and p (period).
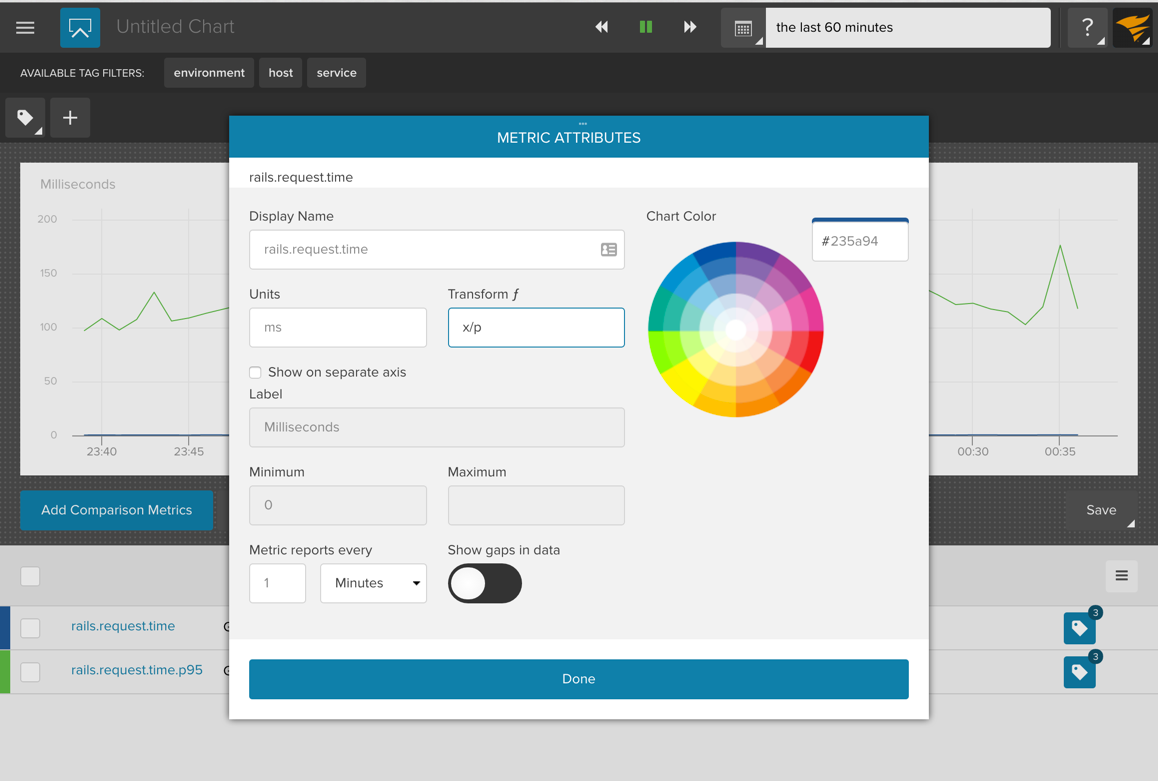
The display transform is set in the stream attributes.
In a chart, click on the menu icon for the metric you want to edit.
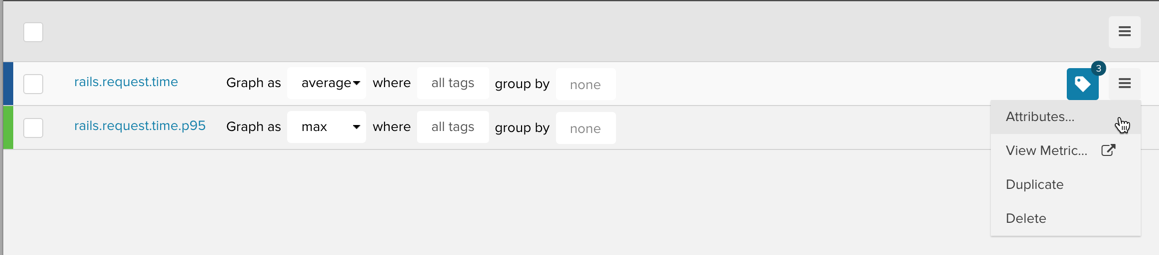
When you click on Attributes… it opens up the stream attributes modal where there is a field for transform function. In this example we are transforming the metric to a rate by dividing x by p.
Using the Period (p) in calculations
On display transform functions, in addition to the variable ‘x’ (value to
transform) you can also specify ‘p’ to mean the current period, which
takes into account the current resolution of the data. Make sure your
Period is defined however, as it will default to ‘1’ on the native
resolution if unspecified. x/p will give you the rate per second. To get
the rate per minute simply use (x/p)*60.
As an example consider the metric
‘librato.interface.eth0.if_octets.rx’ that counts the number of octets
received on the eth0 interface. Specifying a display transform of
(x*8)/1000/1000/p will graph the metrics as megabits/second at
all resolutions.