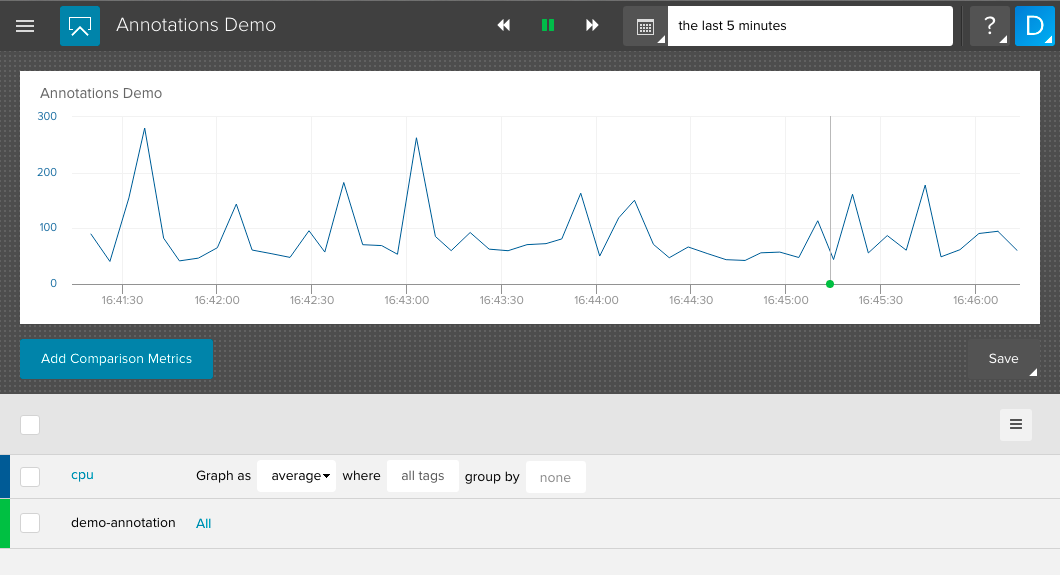
Annotations
Annotations are a powerful tool for correlating your metrics to aperiodic events such as when you deploy software, run an integration test, or turn on a water sprinkler.
Every annotation event is associated with a single named annotation stream,
analogous to how multiple measurements are associated with the named metric
they belong to. For example, you might have an annotation stream named
ux-app-deploys to track deployments to your UX application and another
annotation stream api-app-deploys to track deploys to your API application.
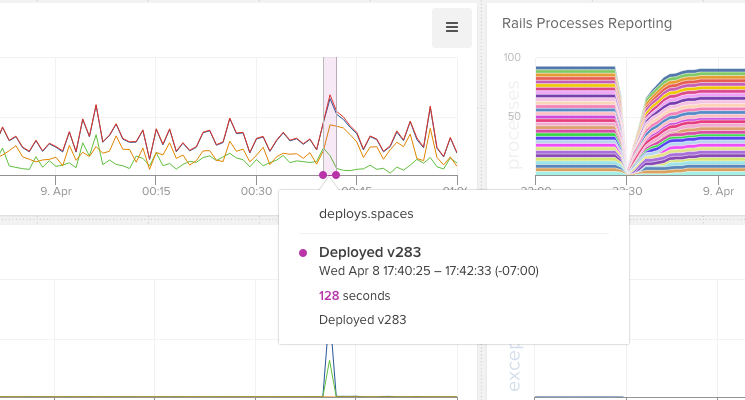
An annotation event can also include an end time to represent an event that spanned a duration of time. For example, a batch job that ran for five minutes would set the annotation event’s start time when the job started and update the annotation event with an end time when the job completed. Annotation events that include an end time will be displayed with their start and end times as connected vertical lines on graphs.
This simple curl POST
to the Librato API creates an annotation event titled Annotation 2 on the
annotation stream annotations-demo:
curl \
  -u ${LIBRATO_USERNAME}:${LIBRATO_TOKEN} \
  -d "start_time=${TIME_NOW}" \
  -d "title=Annotation 2" \
  -d "description=Second Annotation" \
  -d "links[0][rel]=cnn" \
  -d "links[0][label]=CNN News Site" \
  -d "links[0][href]=http://www.cnn.com" \
  -X POST https://metrics-api.librato.com/v1/annotations/annotations-demo
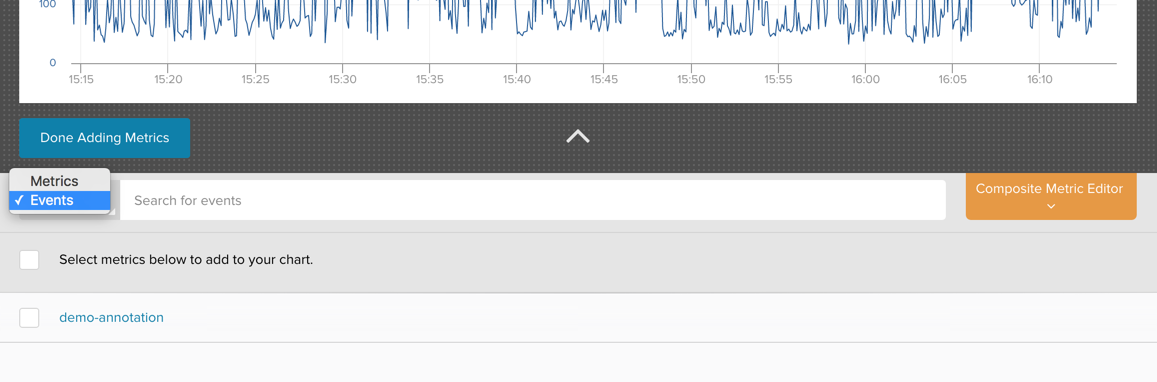
Multiple annotation events can be added to a graph by selecting the name of the annotation stream, similar to selecting a metric name. Edit the chart, click on “Add More Metrics”, then on the triangle in the “Metrics” button. The pull-down menu that opens allows you to select “Events”.
After adding the annotation to the chart, it will show up as an additional row together
with the metrics streams. Make sure the annotation is set to All (it should default
to that).