What is a tag?
Tags can be thought of as members in a population that you are capturing the metric for. Think of it as a multiple identifying dimensions we support in addition to ‘name’ for a metric.
For example the number of requests/second serviced by an application (metric) could be broken up amongst a group of server instances in a scale-out tier (source) by setting the hostname as the tag in the measurement properties.
Hostname is probably the most common use-case but we make no assumption
about tags except that they distinguishes multiple homogeneous “things”
that all have the same metric, so instead of “hostname” you could use
things like customer_id or sensor_id if you wanted.
Tags in the Metrics view
When you click on a metric in your metrics list, it will open the chart
for the metric and below you will see a table with one column per tag.
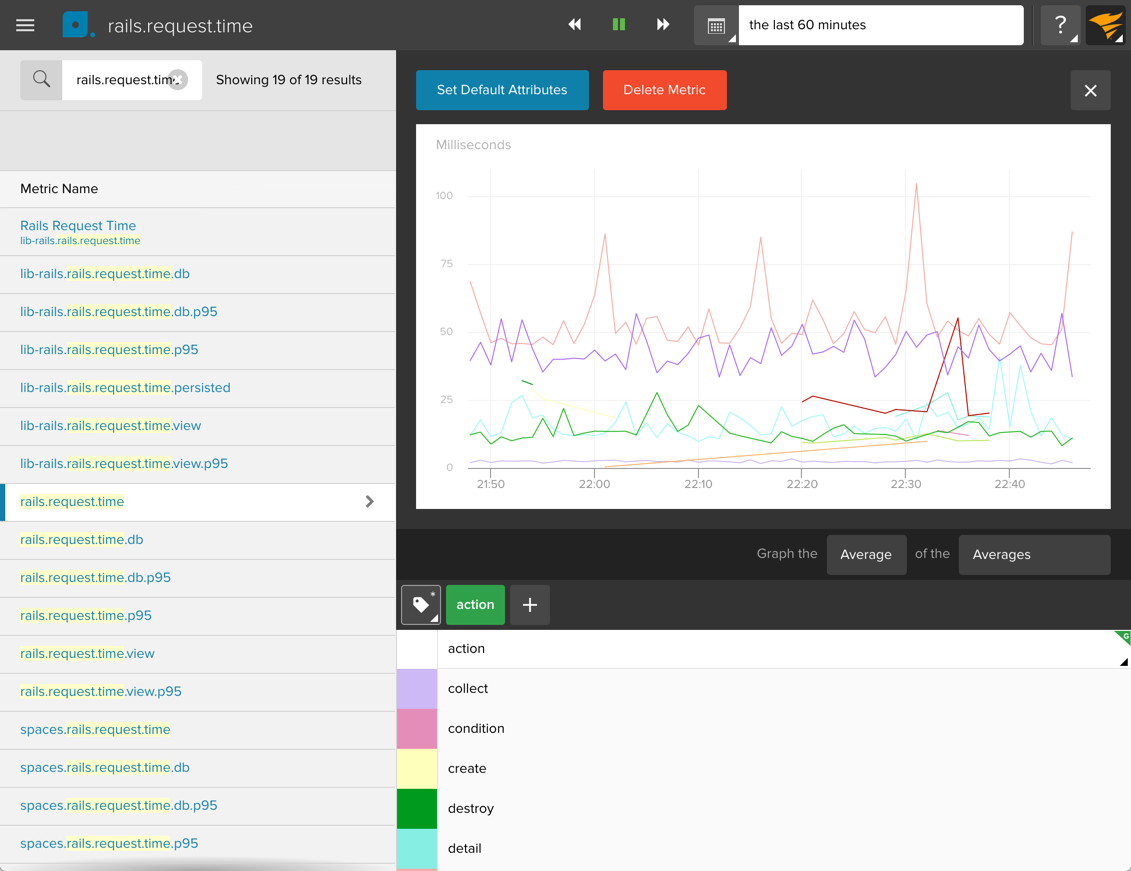
As an example, we have a metric called rails.request.time.
Under the graph of the metric I can see all its tags:
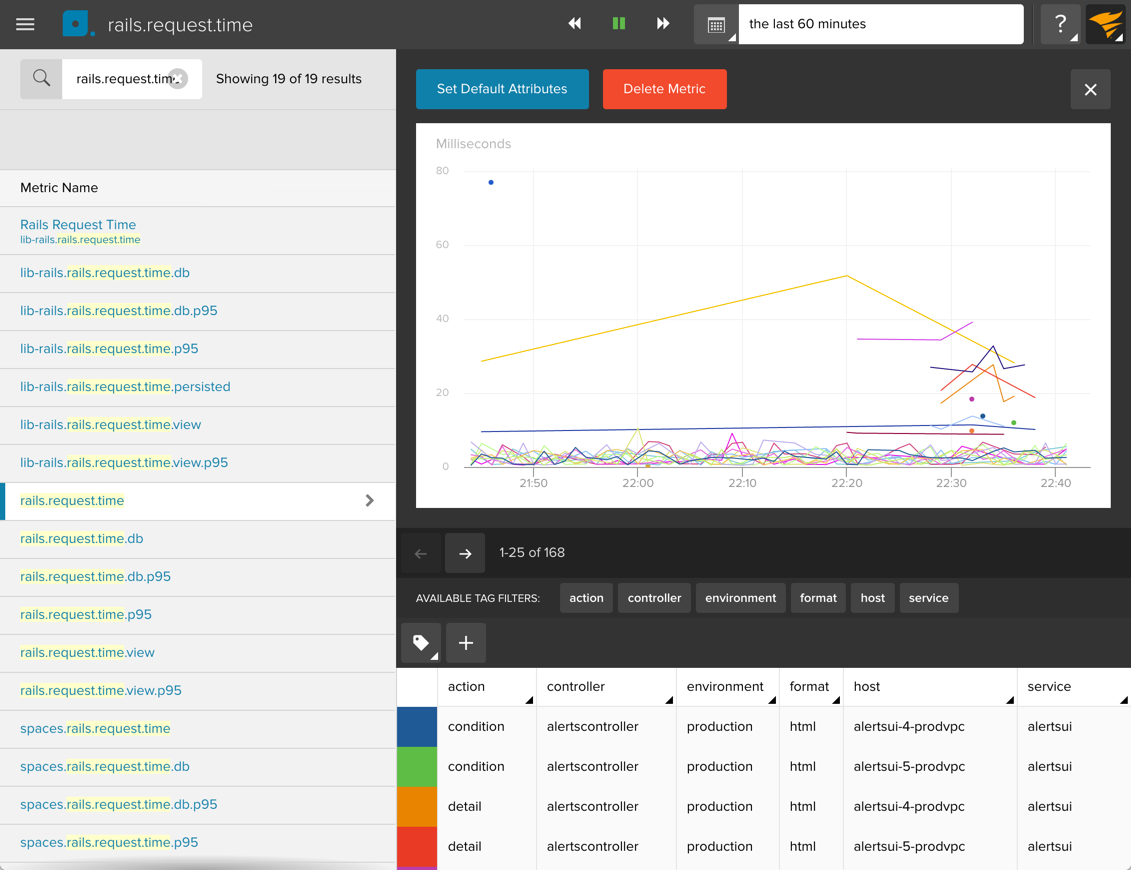
I can use the tags to filter or group metrics strems. For example if
I click on the controller tag, I can filter all metric streams to
only show the create requests. If I group on the controller tag,
the chart shows me one line for each request type: