
AppHarbor Add-On
Librato is an add-on for collecting, understanding, and acting on the metrics that matter to you.
Librato is a complete solution for monitoring and analyzing the metrics that impact your business at all levels of the stack. It provides everything you need to visualize, analyze, and actively alert on the metrics that matter to you. Librato integrates seamlessly with AppHarbor to provide you out-of-the-box detailed information about your application’s performance and per-worker system resources. But that’s just the beginning!
With drop-in support for .Net you’ll additionally have custom application metrics streaming into Librato in minutes. From there you can build tailored charts/dashboards, annotate them with one-time events, and set threshold-based alerts. Collaboration is supported through multi-user access, private dashboard links, PNG chart snapshots, and seamless integration with popular third-party services like PagerDuty, Campfire, HipChat, and others. Additionally Librato is a platform whose complete capabilities are programmatically accessible via a RESTful API.
Provisioning the add-on
Librato can be attached to an AppHarbor application via the web UI:
Go to the AppHarbor add-ons page, select the Librato add-on, then select the application you want to add it to.
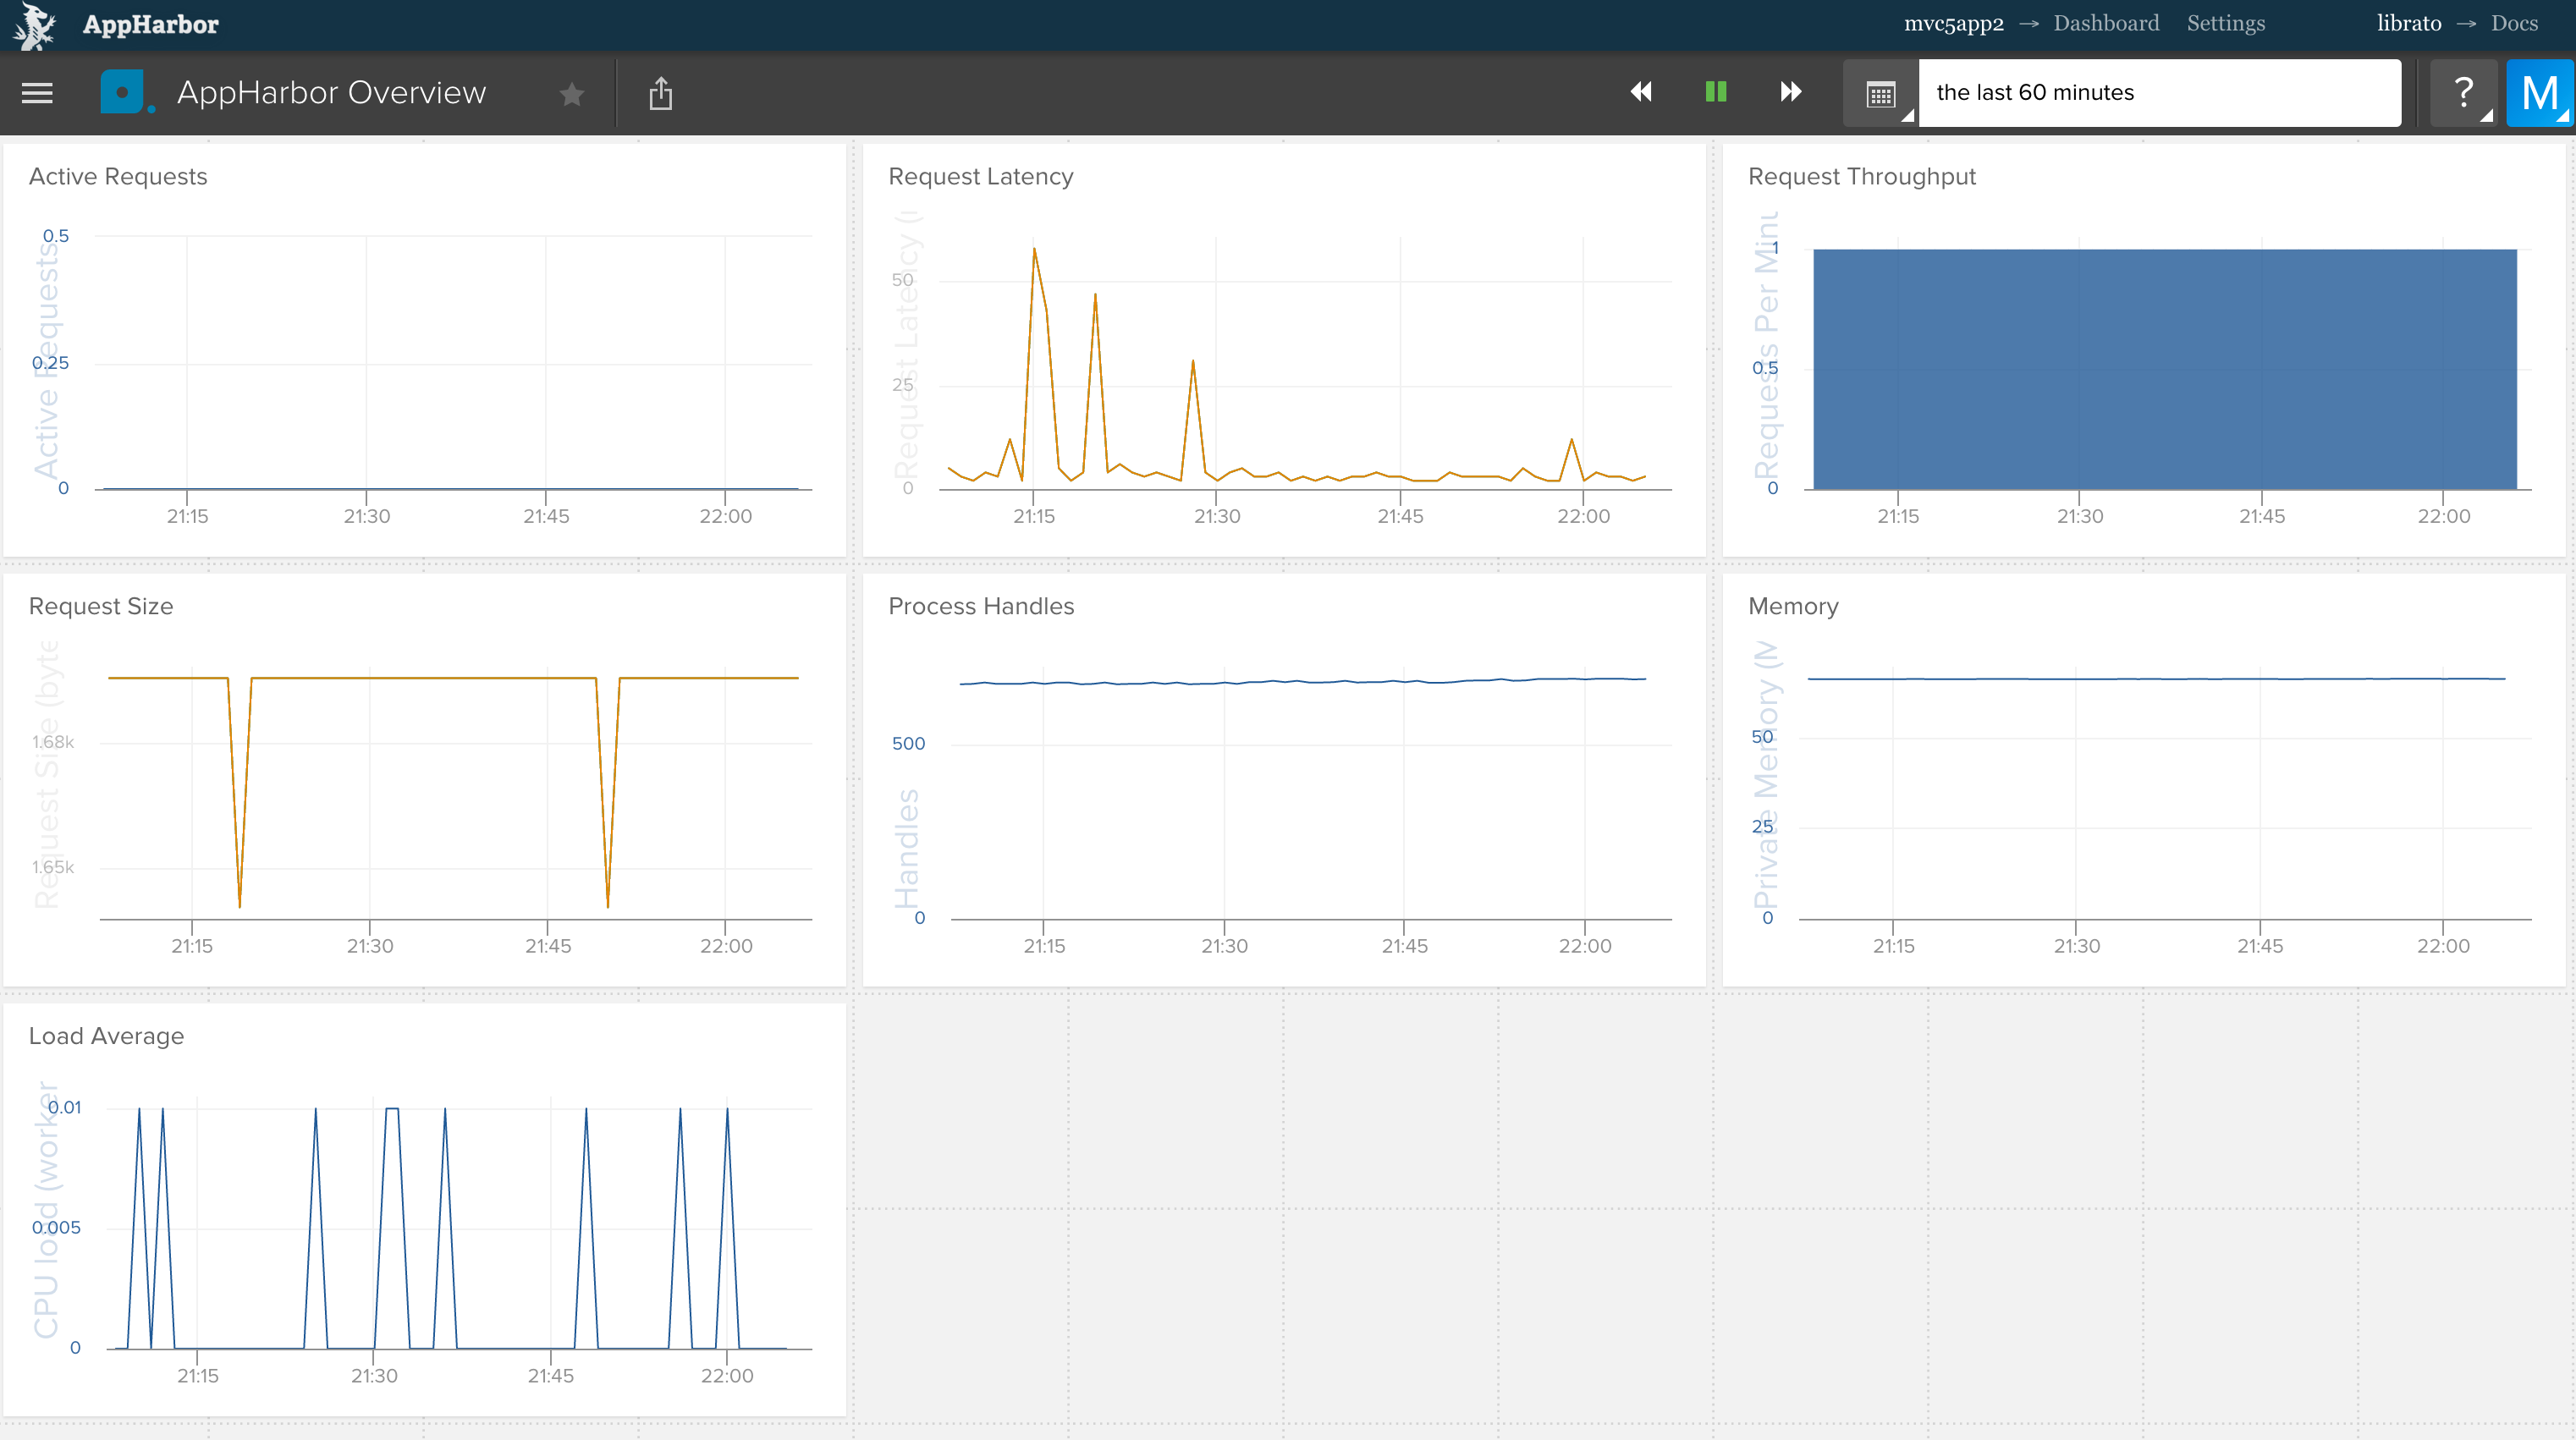
After successful provisioning, the AppHarbor native log-based metrics described below will automatically begin flowing into your Librato account and into a dashboard we’ve pre-configured to provide a basic overview of your application performance. It may take 2-3 minutes for data to begin showing up. You can go to the Librato interface now to check things out or read on to learn more!
Native log-based metrics
After provisioning the add-on, Librato immediately begins collecting native AppHarbor metrics pertaining directly from your application’s log stream.
HTTP router request metrics are present in every AppHarbor application
log stream and provide detailed information about the volume and active
number of requests. The metrics provided by AppHarbor and available in
Librato currently are http.requests and http.active_requests.
Per-worker runtime metrics are available to any AppHarbor application.
They provide insight into memory usage, CPU load and process handle
count of each worker and are reported under the worker’s logical role
e.g. web.1 or worker.2. These metrics are summary statistics
gathered by the AppHarbor Runtime layer and are reported directly into
Librato under their given names.
Custom log-based metrics
In addition to seamlessly extracting native metrics provided by AppHarbor, Librato’s log integration enable you to publish your own custom metrics directly to Librato through your AppHarbor log stream. Simply write your measurements to the Trace Log using one of the formats specified below and Librato will automatically detect and collect your custom metrics. The examples below are in .Net syntax.
Custom counting
Count log lines are used to submit increments to Librato. You can
submit increments as frequently as desired and every minute the current
total will be flushed to Librato and reset to zero. For example the
following combination would result in a value of 5 being recorded for
the enclosing minute in a Librato metric named user.clicks:
Trace.TraceInformation("count#user.clicks=1)
Trace.TraceInformation("count#user.clicks=1")
Trace.TraceInformation("count#user.clicks=3")
Custom distributions
Measure log lines are used to submit individual measurements that comprise a statistical distribution. The most common use case are timings i.e. latency measurements, but it can also be used to represent non-temporal distributions such as counts. You can submit as many measures as you’d like (typically they are submitted per-request) and every minute Librato will calculate/record a complete set of summary statistics over the measures submitted in that interval:
- min - The smallest value.
- max - The largest value.
- average - The average of all values.
- median - The value that falls precisely in the middle of all values. Considered a good indicator of typical application performance.
- 95th percentile - The value that is larger than 95% of all values.
- 99th percentile - The value that is larger than 99% of all values.
- sum - The total of all values.
- count - The total number of values submitted.
Measures are submitted in a similar fashion to counts:
Trace.TraceInformation("measure#database.query=200ms")
Note that measures create 4 separate metrics in Librato based on the submitted measure name. Using the example above, you would find:
database.query- A complex metric that contains the min/mean/max/sum/count values.database.query.median- The median value.database.query.perc95- The 95th percentile value.database.query.perc99- The 99th percentile value.
Custom sample metrics
Sample metrics are used to convey simple key/numerical value pairs
when you are already calculating some kind of summary statistic in your
app and merely need a simple transport mechanism to Librato. Typically
you would submit sample metrics on some periodic tick and set said
period on the metric in Librato. This example would create a metric in
Librato with the name database.size:
Trace.TraceInformation("sample#database.size=40.9MB")
Custom sources
Librato supports an additional dimension to the metric name called a “source”. This enables you to report the same metric associated with multiple different entities and intelligently share a single set of visualizations, alerts, etc. For example our support for AppHarbor’s native runtime metrics uses the worker’s logical role as the source to differentiate between workers. You associate a measurement with a source by adding a source key=value pair to the log line:
Trace.TraceInformation("source=us-east measure#web.latency=4ms")
Note that each source value used in a metric creates a unique metric instance defined by (metric, source) that counts against your current plans capacity for custom metrics as described below.
If you need to determine the name of the worker that you are currently
operating under you can grab the worker_name from the AppHarbor app
settings.
This would only be necessary if you are using a metric library that
spoke directly to the Librato API.
Configuring additional integrations
Once Librato has been added, settings for LIBRATO_USER and
LIBRATO_TOKEN will be available in the app configuration and will
contain the credentials needed to authenticate any integrations to the
Librato API.
The configuration variables are accessible via Configuration variables link next to the add-on on your application’s page or via the “Configuration variables” menu item on the same page. The URL will have the following format:
https://appharbor.com/applications/<your-app-name>/configurationvariables
Using with .NET Log Reporter
Custom Instrumentation
The .NET Log Reporter is a light-weight library that wraps the logging primitives above with a simple metric instrumentation API. Install the reporter from NuGet with the following command:
Install-Package MetricReporter
Once you’ve installed the MetricReporter in your Appharbor application, you can immediately and easily start adding your own custom instrumentation. Just create a metrics reporter and use it to instrument your code.
 # Initialize a MetricWriter

 var metricWriter = new MetricWriter(Console.Out);
var reporter = new MetricReporter(metricWriter);
There are three simple instrumentation primitives available:
Increment
Use for tracking a running total of something across requests, examples:
# increment the 'sales_completed' metric by one
reporter.Increment("sales_completed")

# increment by five
reporter.Increment("items_purchased", incrementBy: 5)

# increment with a custom source
reporter.Increment("user.purchases", source: user.id)
Other things you might track this way: user signups, requests of a certain type or to a certain route, total jobs queued or processed, emails sent or received.
Note that increment is primarily used for tracking the rate of
occurrence of some event. Given this increment metrics are
continuous by default i.e. after being called on a metric once they will
report on every interval, reporting zeros for any interval when
increment was not called on the metric.
Measure
Use when you want to track an average value per-request. Examples:
reporter.Measure("user.social_graph.nodes", 212)
The block form auto-submits the time it took for its contents to execute as the measurement value:
reporter.Measure("search.querytime", ()=>
{
       # Do work
       Thread.sleep(1000);
});
Group
There is also a grouping helper, to make managing nested metrics easier. So this:
reporter.Measure("memcached.gets", 20);
reporter.Measure("memcached.sets", 2);
reporter.Measure("memcached.bytes.read", 342152);
reporter.Measure("memcached.bytes.written", 2183);
Can also be written as:
reporter.Group("memcached", x=>
{
       x.Measure("gets", 20);
       x.Measure("set", 2);

       x.Group("bytes", y=>
       {
               y.Measure("read", 342152);
               y.Measure("written", 2183);
       });
});
Librato Interface
The Librato interface allows you to build custom dashboards, set threshold-based alerts, rapidly detect and diagnose performance regressions in your production infrastructure, gain a deeper, shared understanding of your business across your team, and so much more!.
The interface can be accessed by visiting the applications page and selecting the application in question. Select Librato from the add-ons menu.
General Troubleshooting
It may take 2-3 minutes for the first results to show up in your Metrics account after you have deployed your app and the first request has been received.
Note that if AppHarbor idles your application, measurements will not be sent until it receives another request and is restarted. If you see intermittent gaps in your measurements during periods of low traffic this is the most likely cause.
Picking a plan
The development plan is free and intended to provide you with some
basic, but extremely useful information about your application running
on AppHarbor. It includes all the native metrics and presents them to
you in a single dashboard that displays the last hour of data. To record
custom metrics, configure alerting, access more than the last hour’s
worth of data, etc. you’ll need to upgrade to a paid plan.
Depending on your intended usage level there are several plans to choose from. Each plan includes the native metrics and offers an increasingly larger capacity for other metrics. To determine which plan fits best, take the total number of custom metrics you need and divide by the total number of worker units in your app. Then choose the plan with the correct amount of custom metrics per worker unit.
Custom metrics are typically aggregated across workers in an application
and can be directly decremented from the plan’s capacity when
estimating. Do keep in mind that some primitives (e.g. the measure#
supported in our logging integration) may report different parts of a
distribution as multiple metrics.
The only other component that some advanced users may need to consider is submitting metrics at resolution higher than the default of 60s. All metrics submitted through our logging integration are at 60s resolution, so this section only applies if you are directly submitting metrics to Librato’s API from your application code at an interval of less than 60s. If these conditions apply we normalize your resolution to 60s to calculate the capacity consumed. For example, 10s resolution metrics consume metric capacity at a rate of 2.5x 60s resolution metrics so the Platinum plan that includes 40 custom metrics / worker unit at 60s resolution would include 16 custom metrics / worker unit at 10s resolution.
Migrating between plans
As long as the plan you are migrating to includes enough allocated measurements for your usage, you can migrate between plans at any time without any interruption to your metrics.
Use the AppHarbor UI to migrate to a new plan.
- From the applications page select your application.
- Your application will list the installed add-ons. Click on Librato.
- On the Librato add-on page choose the desired plan.
Removing the add-on
Librato can be removed via the AppHarbor UI.
This will destroy all associated data and cannot be undone!
- From the applications page select your application.
- Your application will list the installed add-ons. Click on Librato.
- On the Librato add-on page choose UNINSTALL.
Note
Librato data can be exported through the Librato API.