
Redis
![]()
Redis is an open source, in-memory data structure store, used as a
database, cache and message broker. Our integration pulls in
statistics from the Redis INFO command for comprehensive and
complete Redis monitoring.
The Librato Agent allows you to easily monitor the health of your Redis service(s). We gather statistics from the Redis INFO command and emit them to your Librato account, along with your other server metrics.
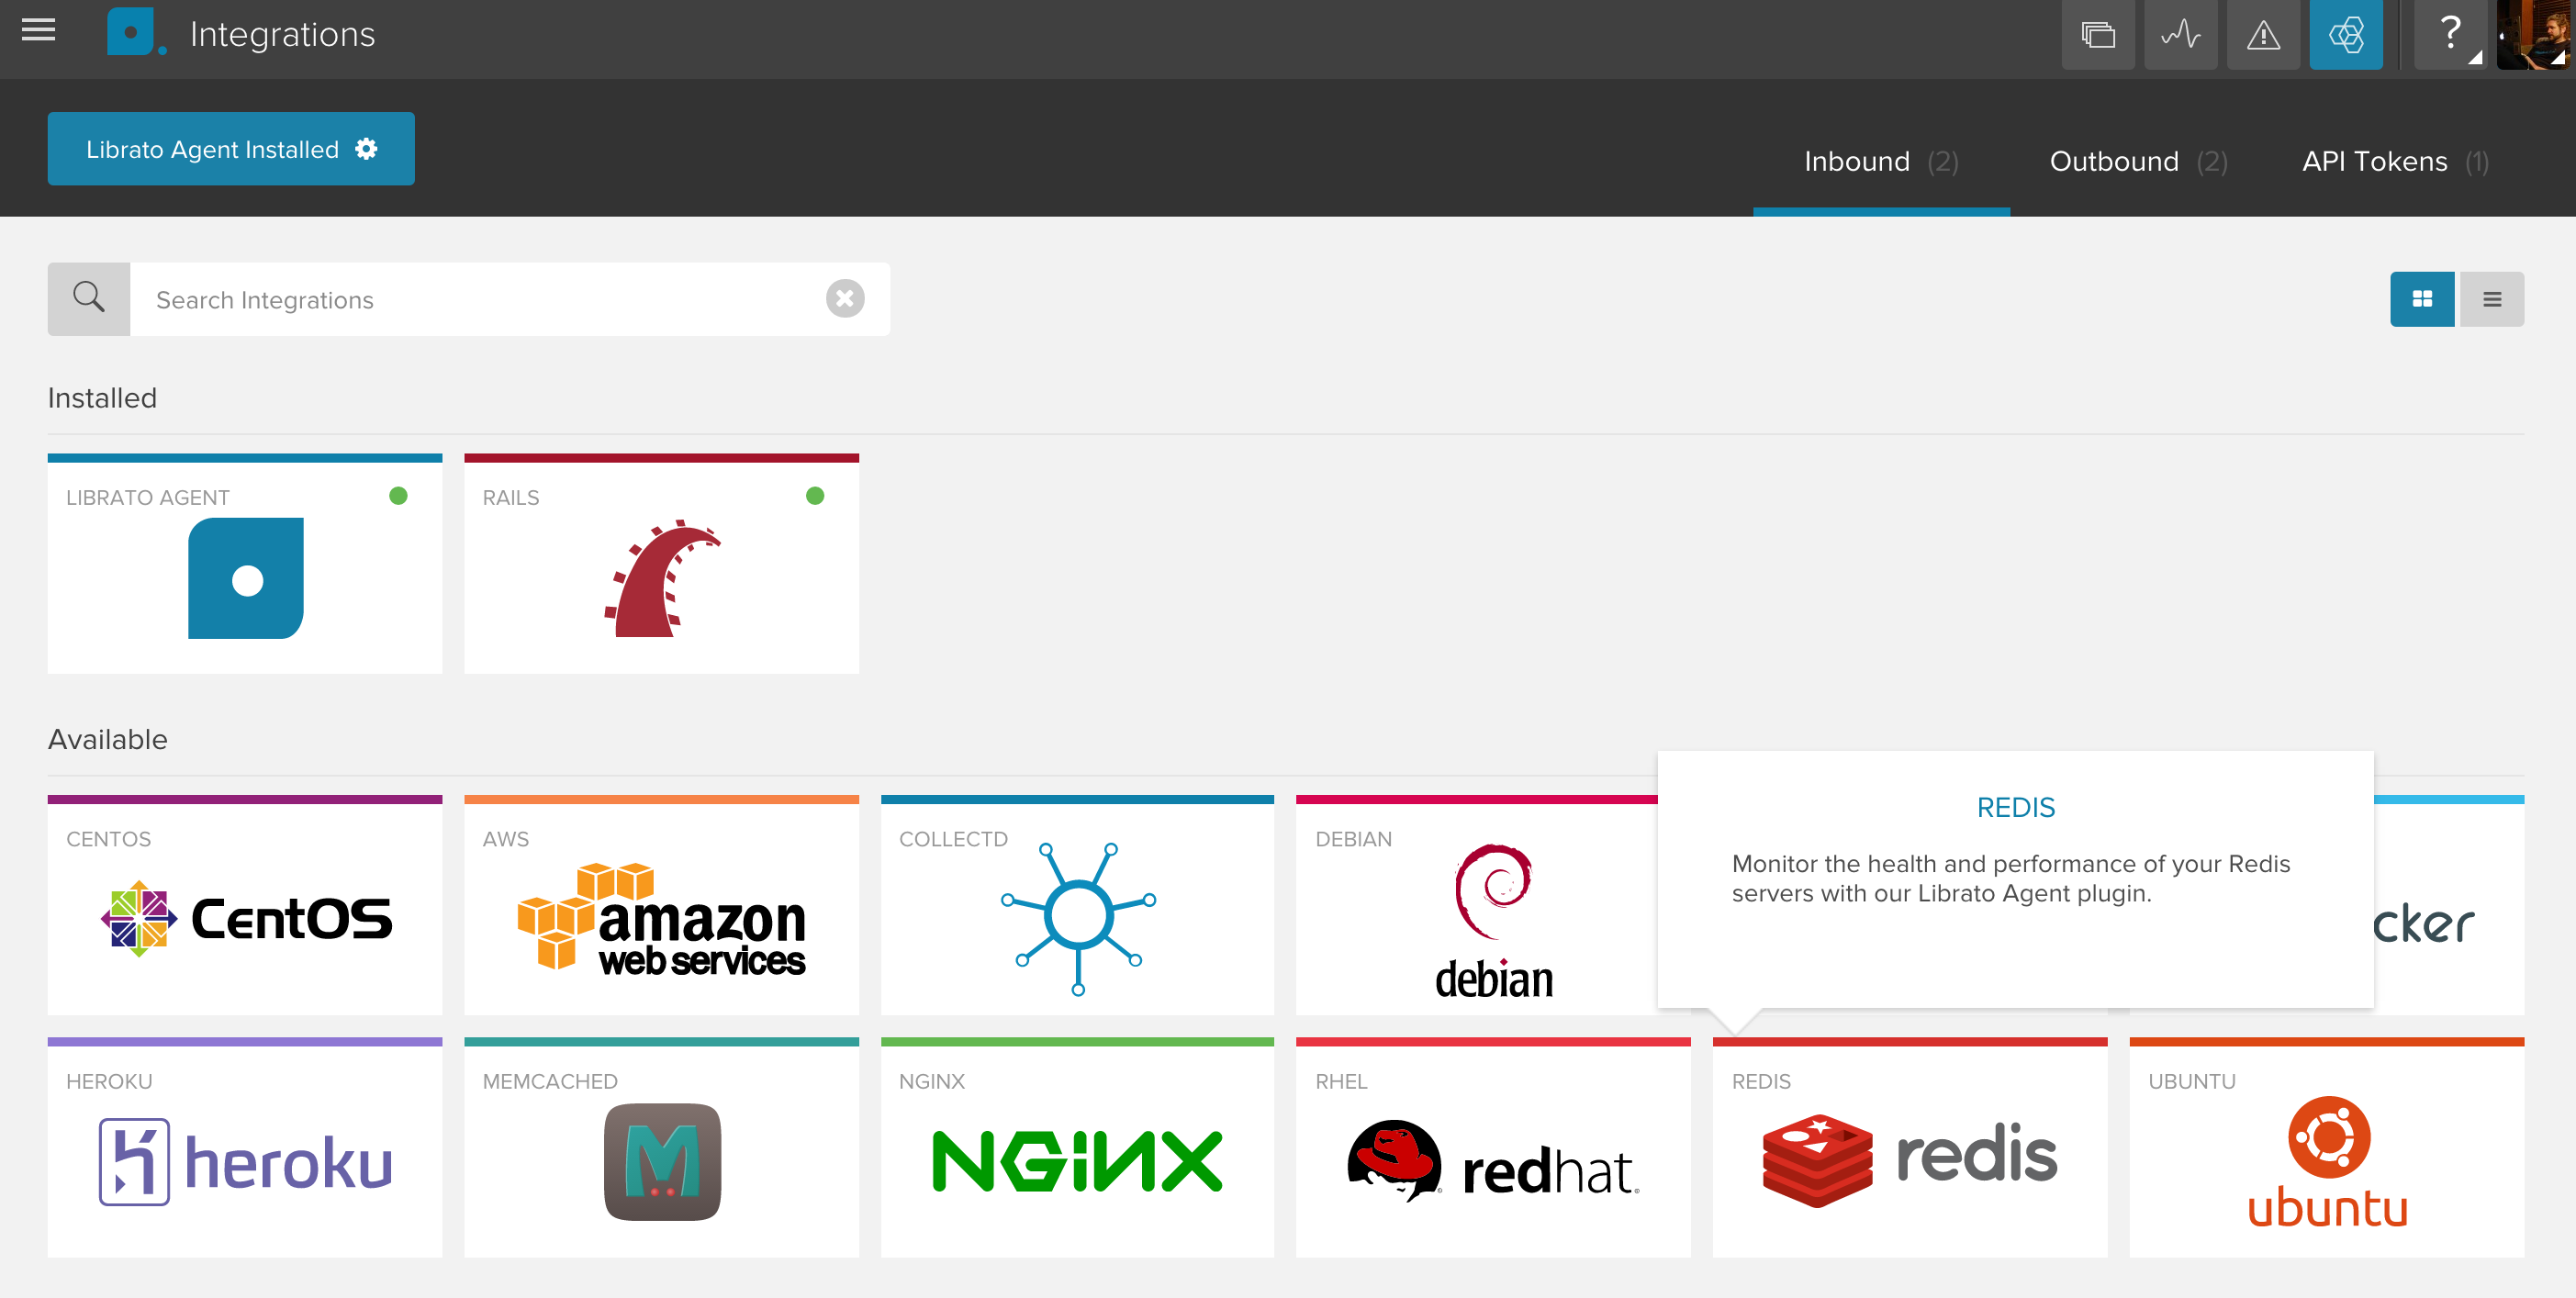
Installation
The Redis integration depends on the Librato Agent. If you haven’t already, you will first need to install the Librato Agent. Once this is complete, select the Redis icon in the integrations catalogue.
Toggle the Enabled switch to activate the Redis integration on your Librato account and create the preconfigured Redis Space.
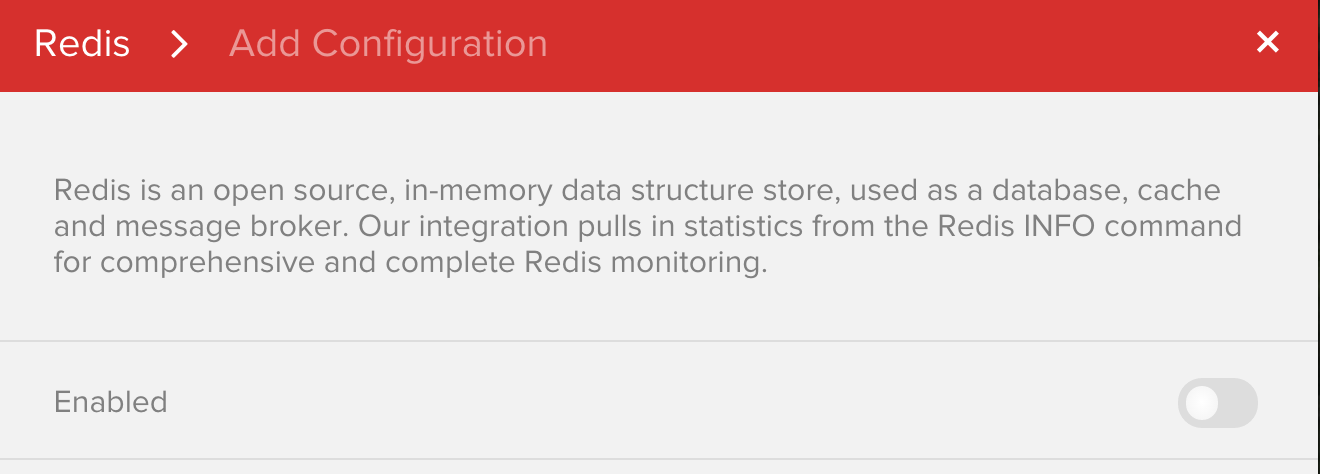
At this point your integration is complete and any Redis metrics associated with this integration will be allowed through your Librato Agent service-side filters.
Plugin Configuration
By default, Redis listens on localhost port 6379. If necessary, this can
be adjusted in your /opt/collectd/etc/collectd.conf.d/redis.conf file.
LoadPlugin redis
<Plugin redis>
  <Node localhost>
    Host "localhost"
    Port "6379"
    Timeout 2000
  </Node>
</Plugin>
Note: You must restart the agent after any changes to your Librato Agent configuration files.
$ sudo service collectd restart
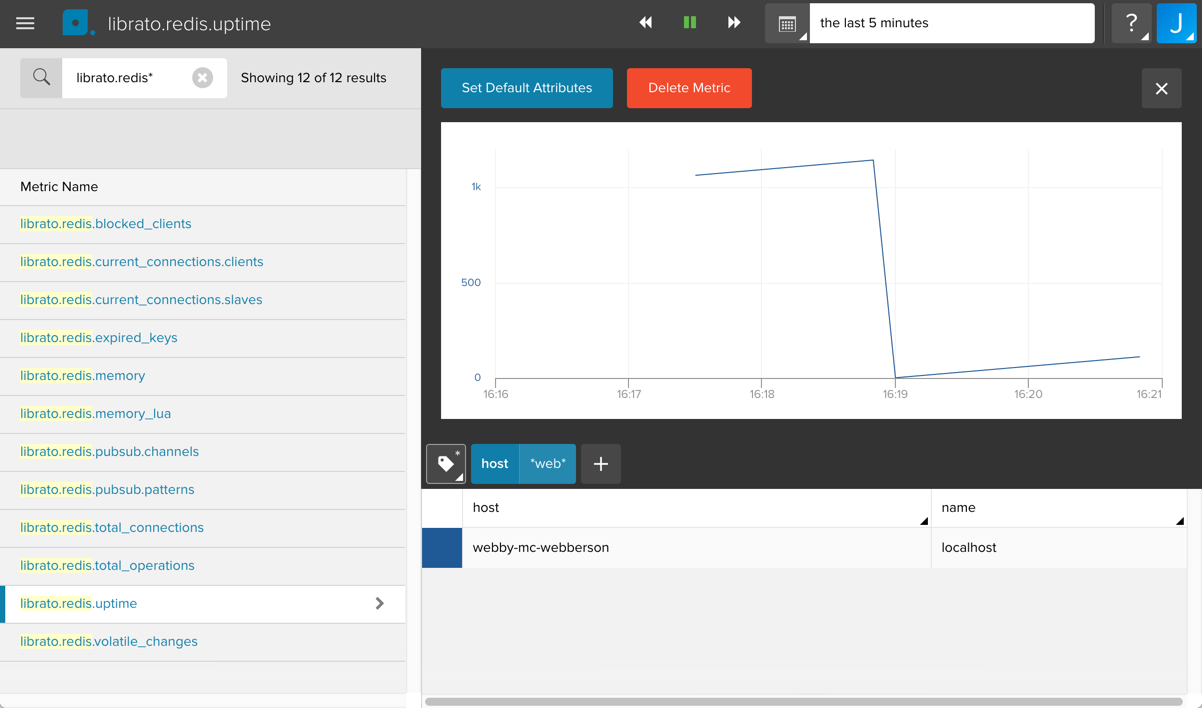
At this point you should begin seeing librato.redis.* metrics in your Librato account.
Filtering by Node
This plugin is optimized for the Librato monitoring service. Besides
simply gathering all of the service metrics made available via the
INFO command, we normalize the metrics so that the Node (as
defined in redis.conf) is captured in the name tag. By
default we set this value to localhost, although you can edit this
value (or add more services) and Librato will automatically add a data stream
for each Node given. This makes it easy to
leverage Librato’s dynamic tags
feature across your Redis services.
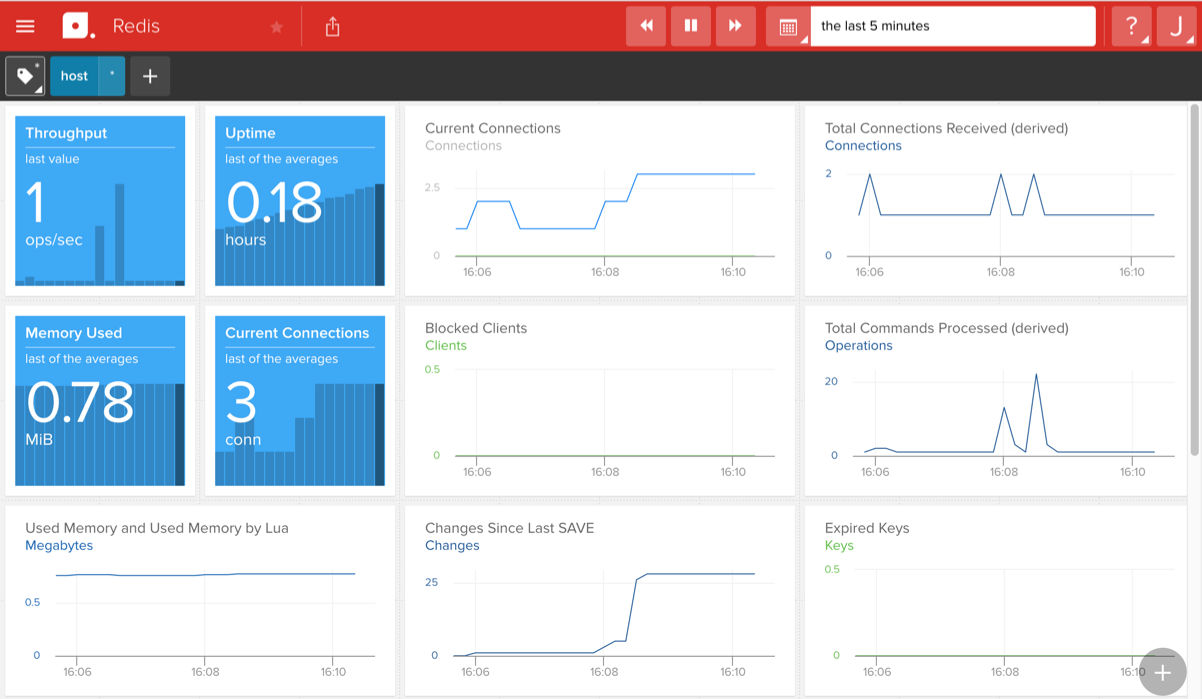
Redis Workspace
Visit your preconfigured Space to observe your new metrics as they stream in. You can use our dynamic tags field at the top to filter your view to a subset of metrics.
FAQ
For specific answers to Librato Agent questions check out our Librato Agent FAQ.
Please let us know what you think about this integration. We would love to incorporate your feedback and any ideas you have on dashboard design into the ongoing development of our integrations.