
PostgreSQL
![]()
PostgreSQL is the world’s most advanced database system, with a global community of thousands of users and contributors and dozens of companies and organizations.
Create the Integration
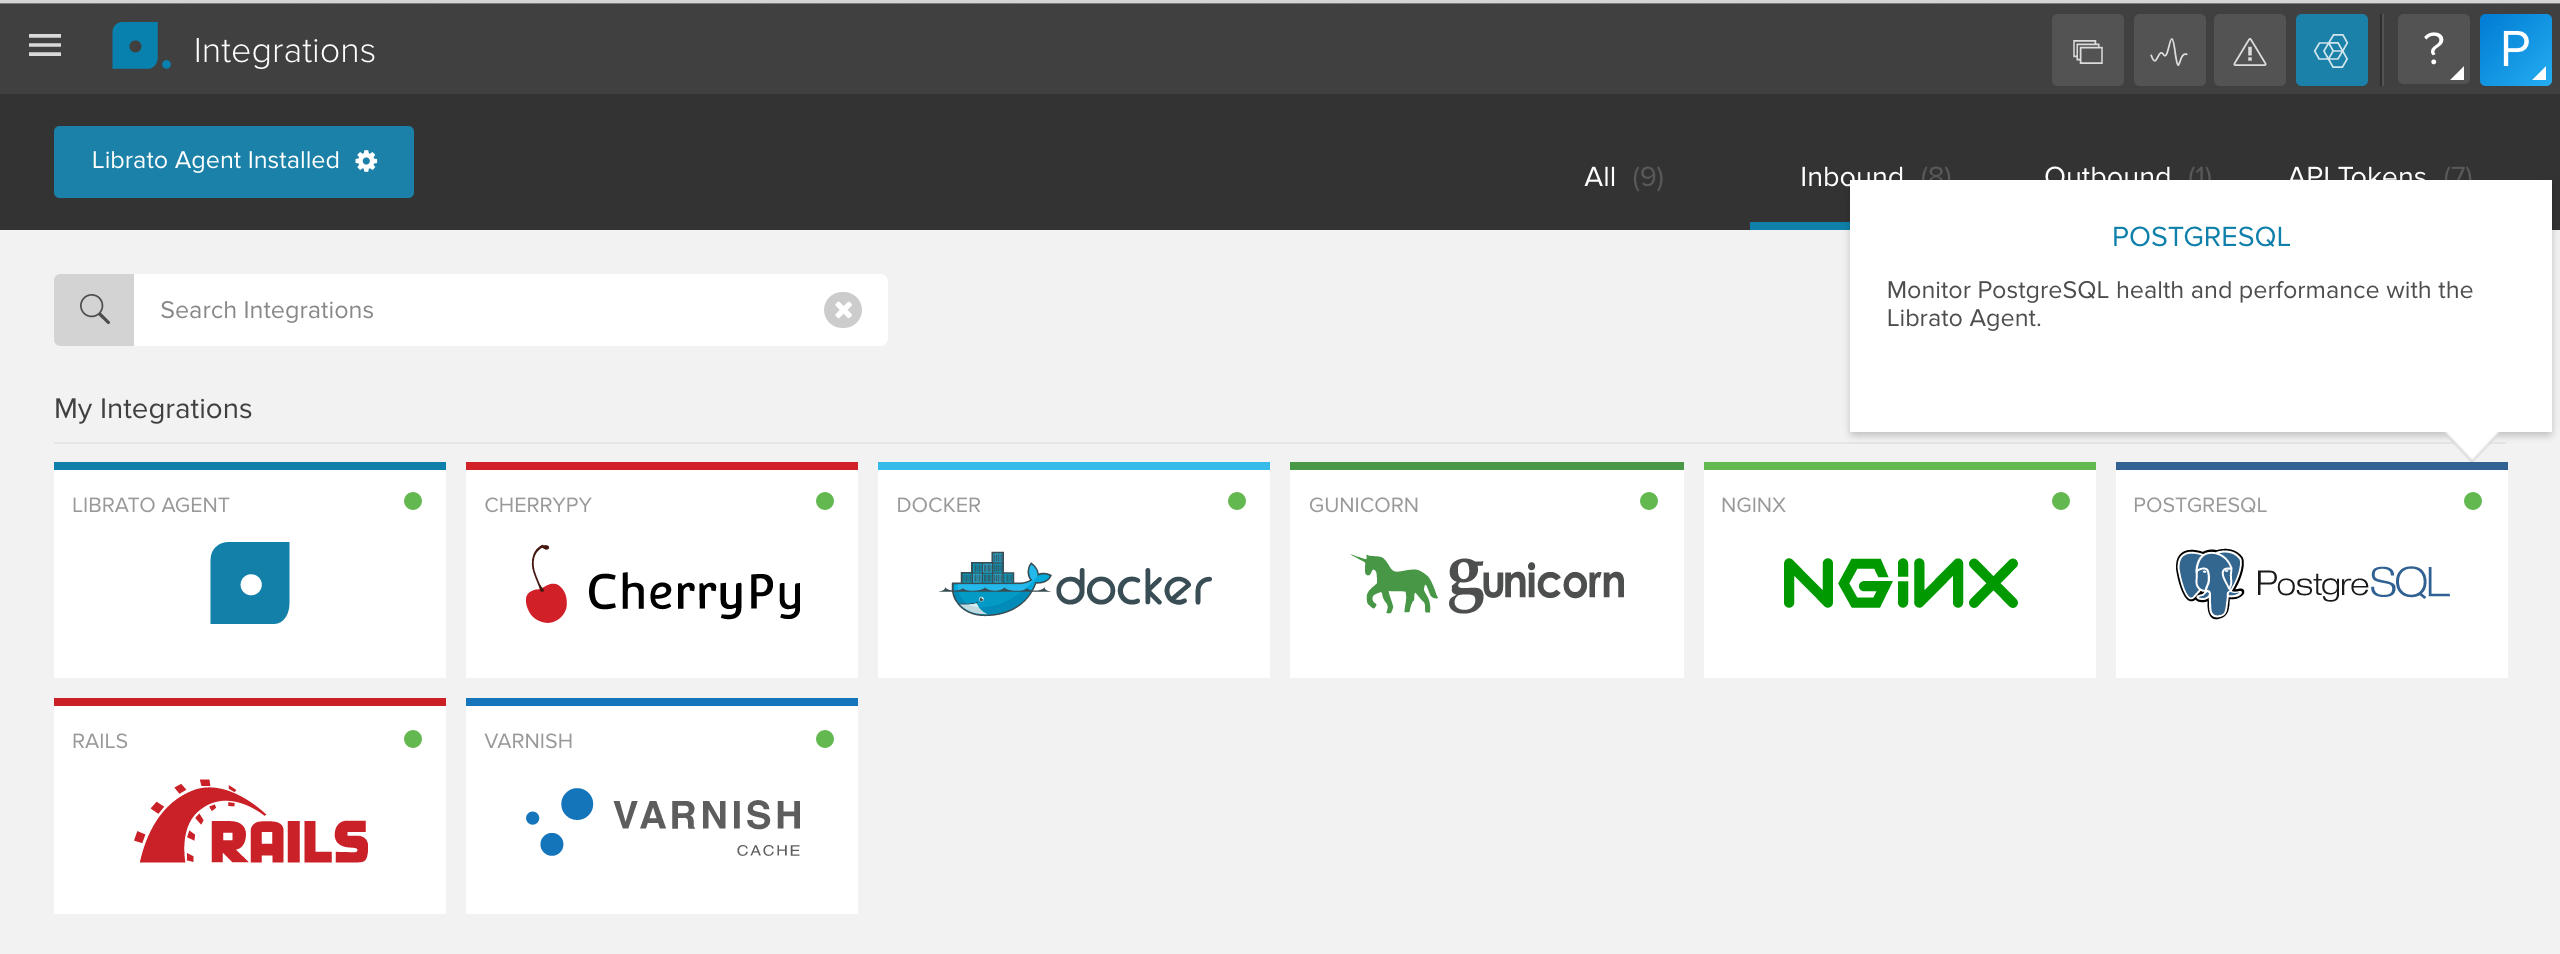
The PostgreSQL integration depends on the Librato Agent. If you haven’t already, you will first need to install the Librato Agent. Once this is complete, select the PostgreSQL icon in the integrations catalogue.
Toggle the Enabled switch to activate the PostgreSQL integration on your Librato account and create the preconfigured PostgreSQL space.
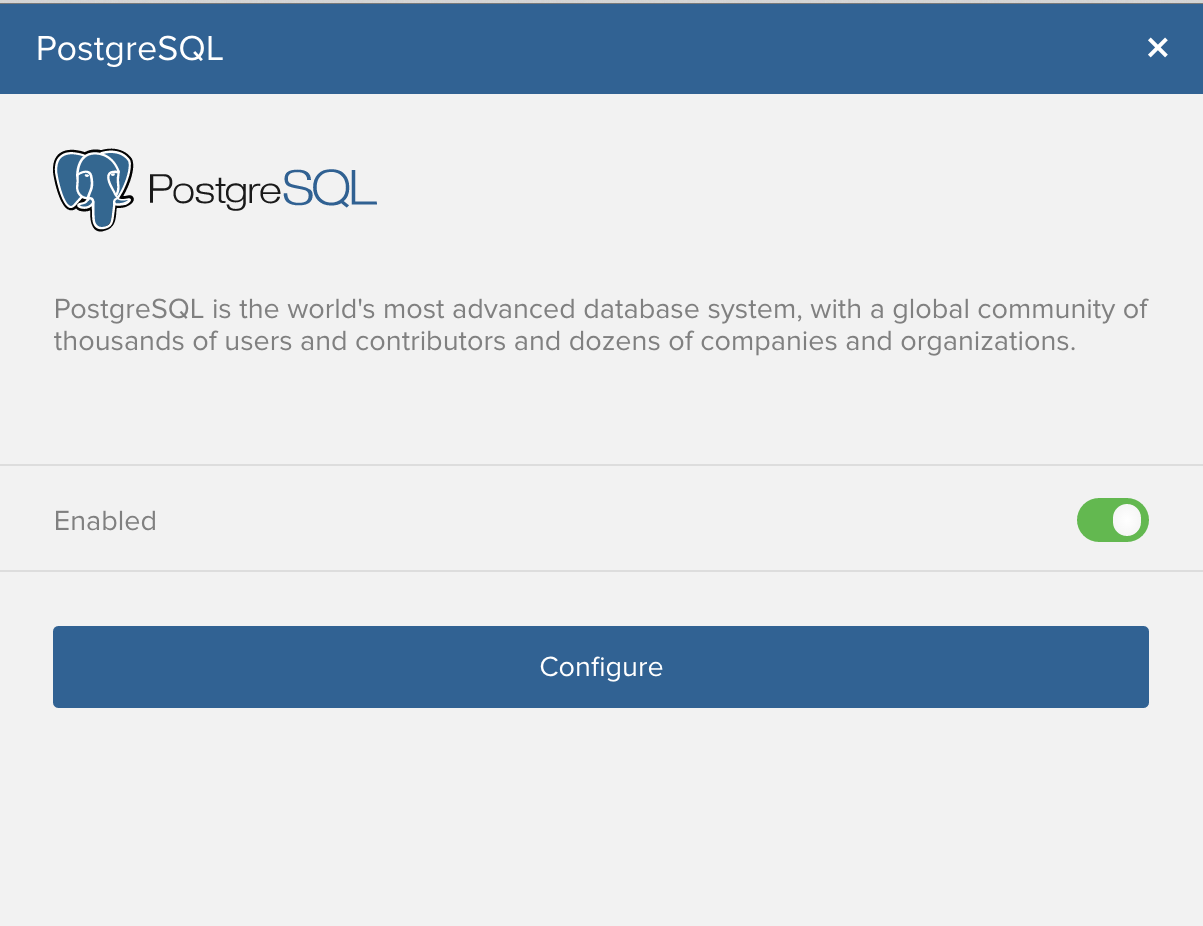
At this point any PostgreSQL metrics associated with this integration will be allowed through your Librato Agent service-side filters. Proceed to configure the PostgreSQL plugin for each PostgreSQL server you would like to monitor.
Plugin Configuration
Librato Agent provides a default /opt/collectd/etc/collectd.conf.d/postgresql.conf
configuration file, which must be edited to suit your environment.
The first Database instance gathers useful stats from the postgres database,
connecting through the /var/run/postgresql socket as the postgres user. Most
PostgreSQL installations will require changes to the authentication settings in
pg_hba.conf
to allow this connection. Canned Query statements are defined in
/opt/collectd/share/collectd/postgresql_default.conf and referenced in the plugin
configuration to run SQL queries and parse the results into metrics for this integration.
Please see the official collectd PostgreSQL plugin documentation for a thorough explanation of all settings, including query examples.
LoadPlugin postgresql
<Plugin postgresql>
  <Database postgres>
    Host "/var/run/postgresql"
    User "postgres"
    Query connections
    Query transactions
    Query queries
    Query query_plans
    Query table_states
    Query disk_io
    Query disk_usage
  </Database>
  #<Database foo>
  #  Instance "custom-name"
  #  Host "127.0.0.1"
  #  Port "5432"
  #  User "username"
  #  Password "password"
  #  SSLMode "prefer"
  #</Database>
</Plugin>
Note: You must restart the agent after any changes to your Librato Agent configuration files.
$ sudo service collectd restart
At this point you should begin seeing librato.postgresql.* metrics in your Librato account.
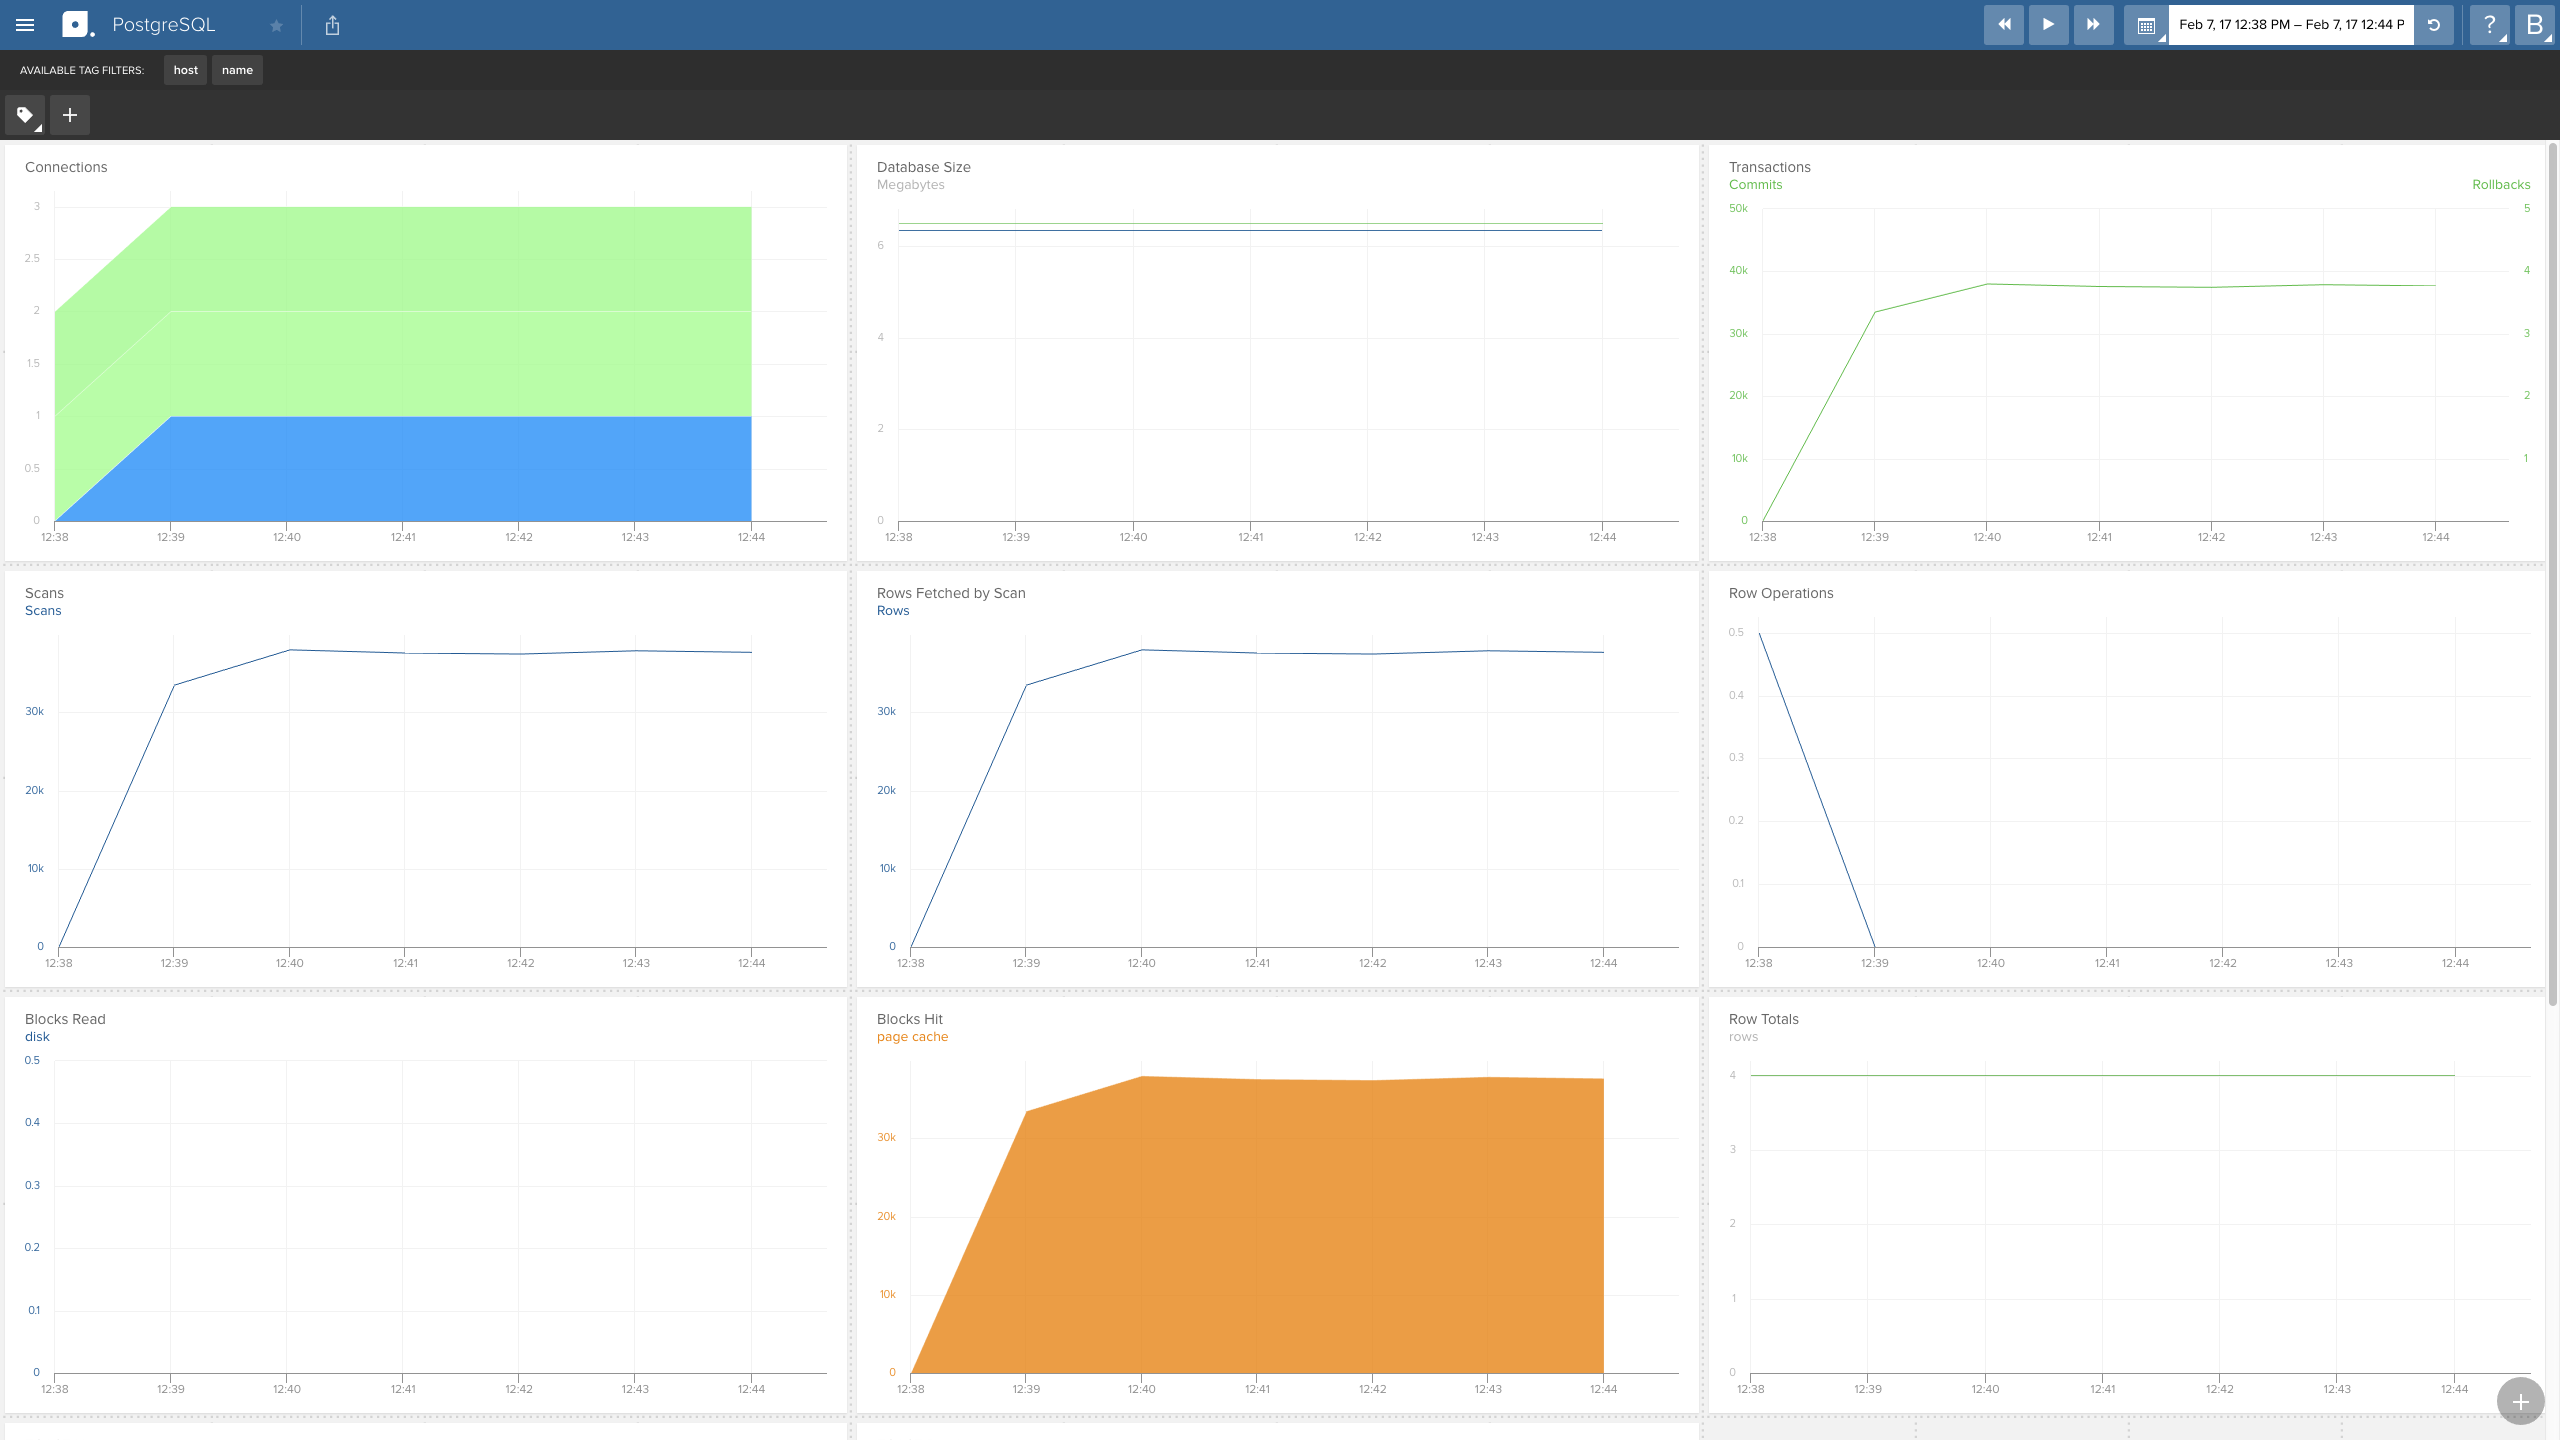
PostgreSQL Workspace
Visit your PostgreSQL preconfigured spaces to observe your new metrics as they stream in.
PostgreSQL Metrics and tags
The PostgreSQL integration supports the following metrics and tags.
Note: All metrics are prefixed with librato.postgresql..
| Tag Name | Description |
|---|---|
| host | Host name or IP address of monitored server |
| name | Name of the database being monitored |
Connection, database and transaction statistics
| Description | Name | Tags |
|---|---|---|
| Aborted transactions | connections.aborted_transactions | host, name |
| Active connections | connections.active | host, name |
| Disabled connections | connections.disabled | host, name |
| Fast-path connections | connections.fastpath | host, name |
| Idle connections | connections.idle | host, name |
| Idle transactions | connections.idle_transactions | host, name |
| Number of Commits | commits | host, name |
| Number of Rollbacks | rollbacks | host, name |
| Size of the database | pg_db_size | host, name |
Row operation and count statistics
| Description | Name | Tags |
|---|---|---|
| DELETE operations | rows.deleted | host, name |
| HOT (Heap-only tuples) UPDATE operations | rows.hot_updated | host, name |
| INSERT operations | rows.inserted | host, name |
| UPDATE operations | rows.updateed | host, name |
| Live row count | rows.live | host, name |
| Dead row count | rows.dead | host, name |
Scan operation statistics
| Description | Name | Tags |
|---|---|---|
| Index scans | scans.index | host, name |
| Sequential scans | scans.seq | host, name |
| Rows fetched by index scans | scans.index_tup_fetch | host, name |
| Rows read by sequential scans | scans.seq_tup_read | host, name |
Disk block read / hit statistics
| Description | Name | Tags |
|---|---|---|
| Disk block reads for a table | blocks.heap_read | host, name |
| Disk block reads for indexes on a table | blocks.index_read | host, name |
| Buffer hits for a table | blocks.heap_hit | host, name |
| Buffer hits for indexes on a table | blocks.index_hit | host, name |
TOAST (The Oversized-Attribute Storage Technique) read / hit statistics
| Description | Name | Tags |
|---|---|---|
| Disk block reads for a table’s TOAST table | blocks.toast_read | host, name |
| Disk block reads on a table’s TOAST table index | blocks.tindex_read | host, name |
| Buffer hits for a table’s TOAST table | blocks.toast_hit | host, name |
| Buffer hits on a table’s TOAST table index | blocks.tindex_hit | host, name |
Remote Databases
It’s also possible to monitor remote PostgreSQL instances with this integration, such
as those running on AWS RDS
or Heroku Postgres. You’ll need to pick a server to
run the Librato Agent plugin, then configure it with the Host and Port settings
for the remote service, and your authentication credentials for the database.
LoadPlugin postgresql
<Plugin postgresql>
  <Database web>
    Instance "custom-name"
    Host "remote-instance.example.com"
    Port "5432"
    User "username"
    Password "password"
    SSLMode "prefer"
    Query connections
    Query transactions
    Query queries
    Query query_plans
    Query table_states
    Query disk_io
    Query disk_usage
  </Database>
</Plugin>
Custom Queries
The following snippet demonstrates one of the included canned Query statements,
collecting the disk usage for the specified database. Queries like this one are
straight-forward, where the column name and value returned are directly mapped to the
metric name and measurement reported to Librato.
<Query disk_usage>
  Statement "SELECT pg_database_size($1) AS size;"
  Param database
  <Result>
    Type pg_db_size
    ValuesFrom "size"
  </Result>
</Query>
This example is a bit more advanced. Here we want to count the number of instances a
particular string was found in the query results. Using some PostgreSQL case
statements we’re able to tabulate the running total and return the results in a format
that the collectd plugin can parse.
<Query connections>
  Statement "SELECT \
              sum(case when state = 'active' then 1 else 0 end) active, \
              sum(case when state = 'idle' then 1 else 0 end) idle \
              FROM pg_stat_activity WHERE datname = $1;"
  Param database
  <Result>
    Type "pg_numbackends"
    InstancePrefix "active"
    ValuesFrom "active"
  </Result>
  <Result>
    Type "pg_numbackends"
    InstancePrefix "idle"
    ValuesFrom "idle"
  </Result>
</Query>
The official collectd
PostgreSQL plugin
documentation contains full explanations for each Query option.
FAQ
For specific answers to Librato Agent questions check out our Librato Agent FAQ.
Let us know what you think when you take this for a spin. We would love to incorporate your feedback and any new dashboards you design into the ongoing development of this key server monitoring technology.