
MySQL
![]()
MySQL is the world’s most popular open source database, enabling the cost-effective delivery of reliable, high-performance and scalable Web-based and embedded database applications, including all five of the top five websites.
The Librato Agent allows you to easily monitor MySQL’s health and performance. We use collectd’s native MySQL plugin to gather metrics from your running MySQL instance(s).
Create the Integration
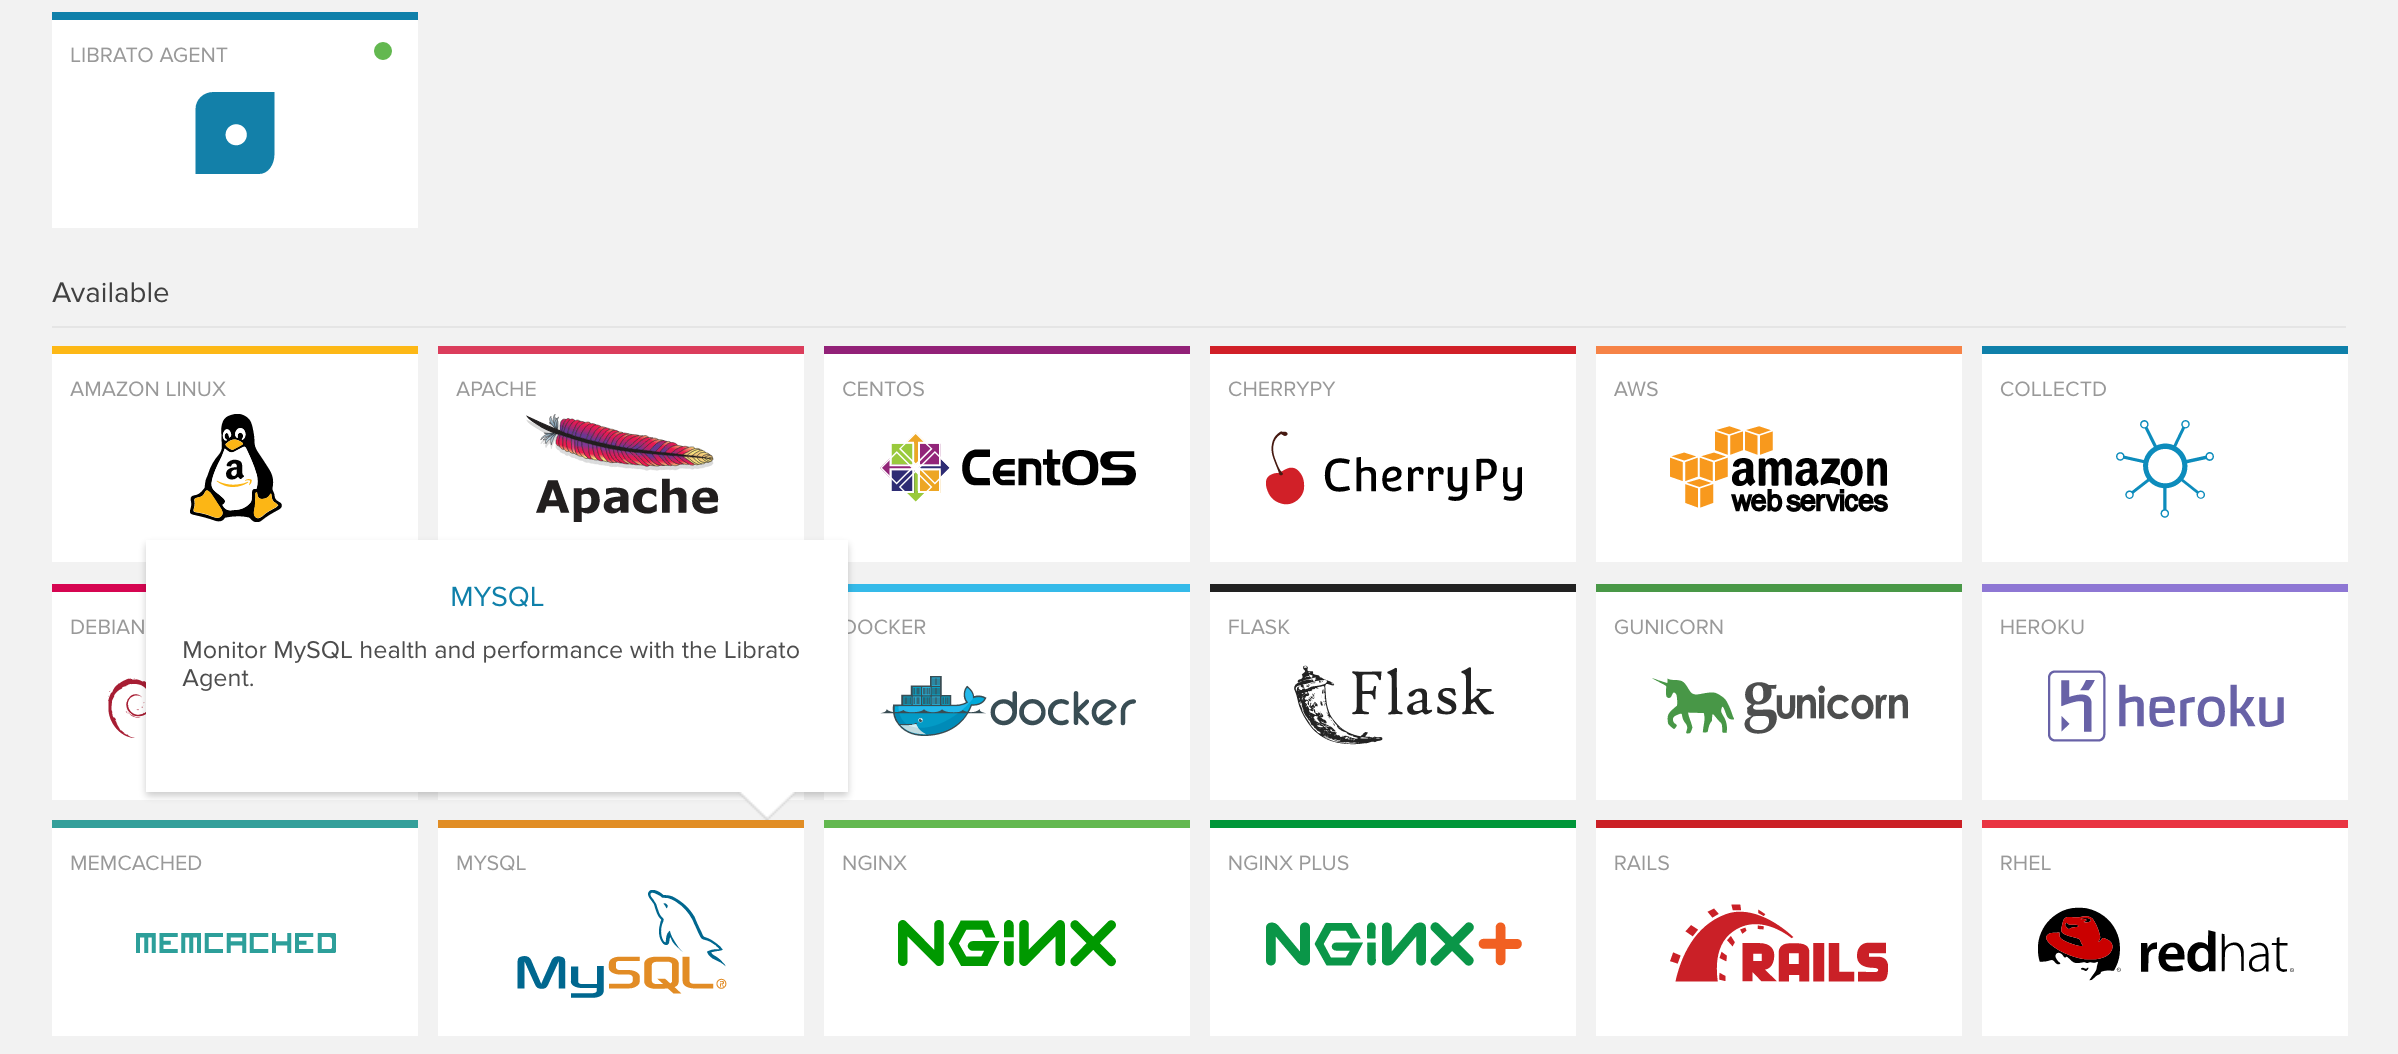
The MySQL integration depends on the Librato Agent. If you haven’t already, you will first need to install the Librato Agent. Once this is complete, select the MySQL icon in the integrations catalogue.
Toggle the Enabled switch to activate the MySQL integration on your Librato account and create the preconfigured MySQL spaces.
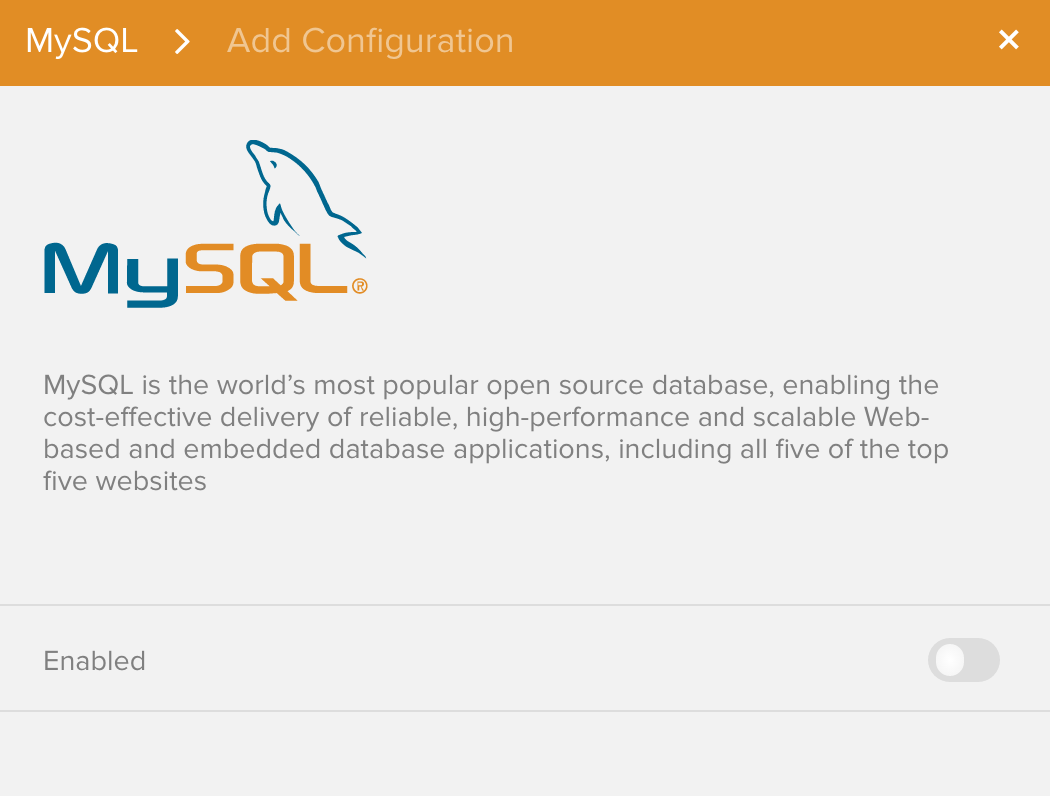
At this point any MySQL metrics associated with this integration will be allowed through your Librato Agent service-side filters. Proceed to configure the MySQL plugin for each MySQL server you would like to monitor.
Plugin Configuration
Librato Agent provides a default /opt/collectd/etc/collectd.conf.d/mysql.conf
configuration file, which must be edited to suit your environment.
LoadPlugin mysql
<Plugin "mysql">
  <Database "mydb">
    Host "127.0.0.1"
    User "root"
    Password ""
    Port 3306
    InnodbStats true
    #SlaveStats true
  </Database>
</Plugin>
Replace mydb with a valid database name, and User and Password with a
user who has permissions to connect to the database. Uncomment SlaveStats if you
are attempting to monitor a replicated MySQL instance.
Please see the MySQL collectd Plugin documentation for additional details.
Note: You must restart the agent after any changes to your Librato Agent configuration files.
$ sudo service collectd restart
At this point you should begin seeing librato.mysql.* metrics in your Librato account.
MySQL Workspaces
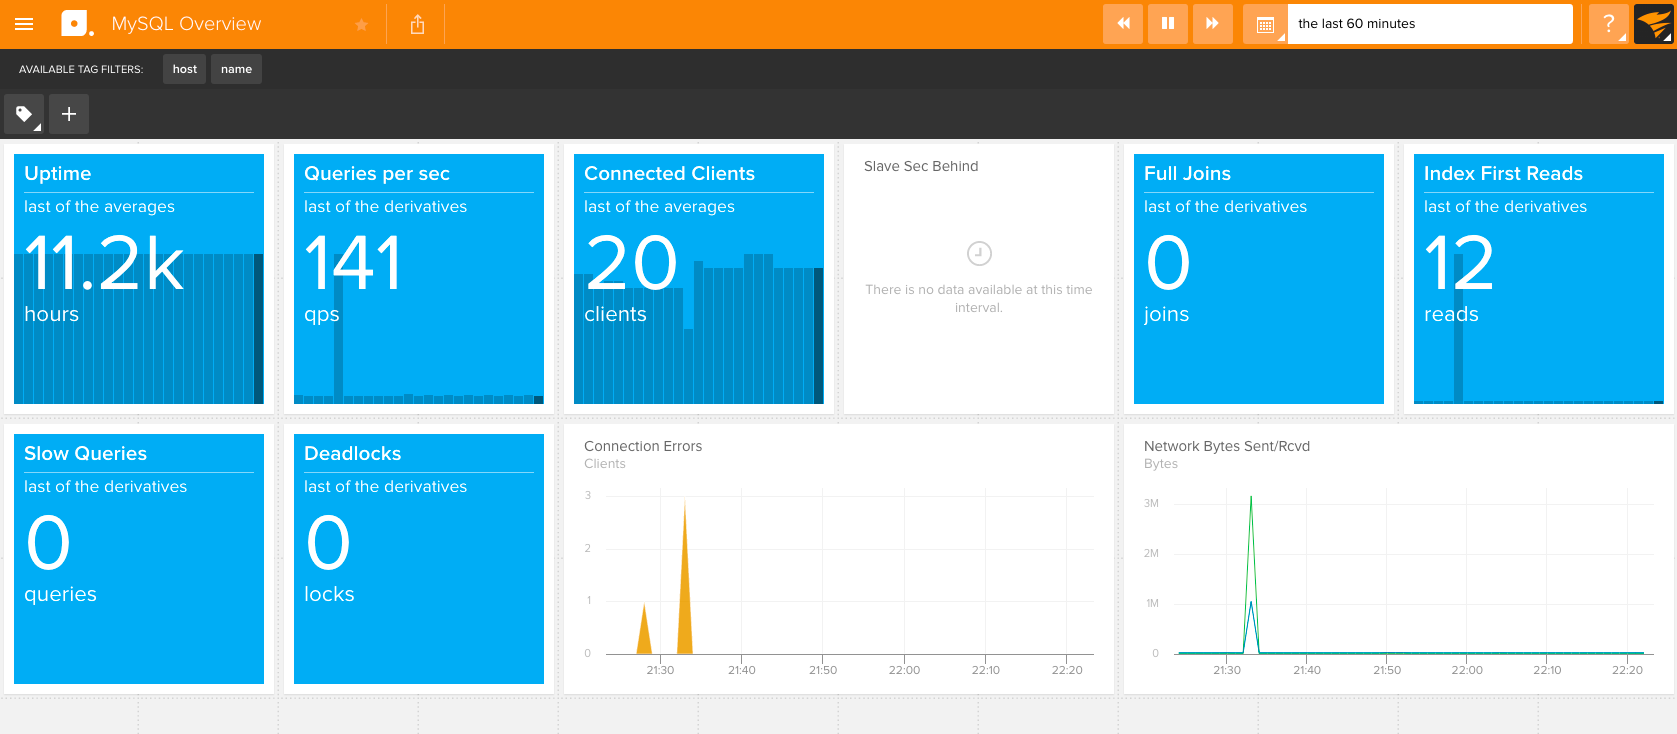
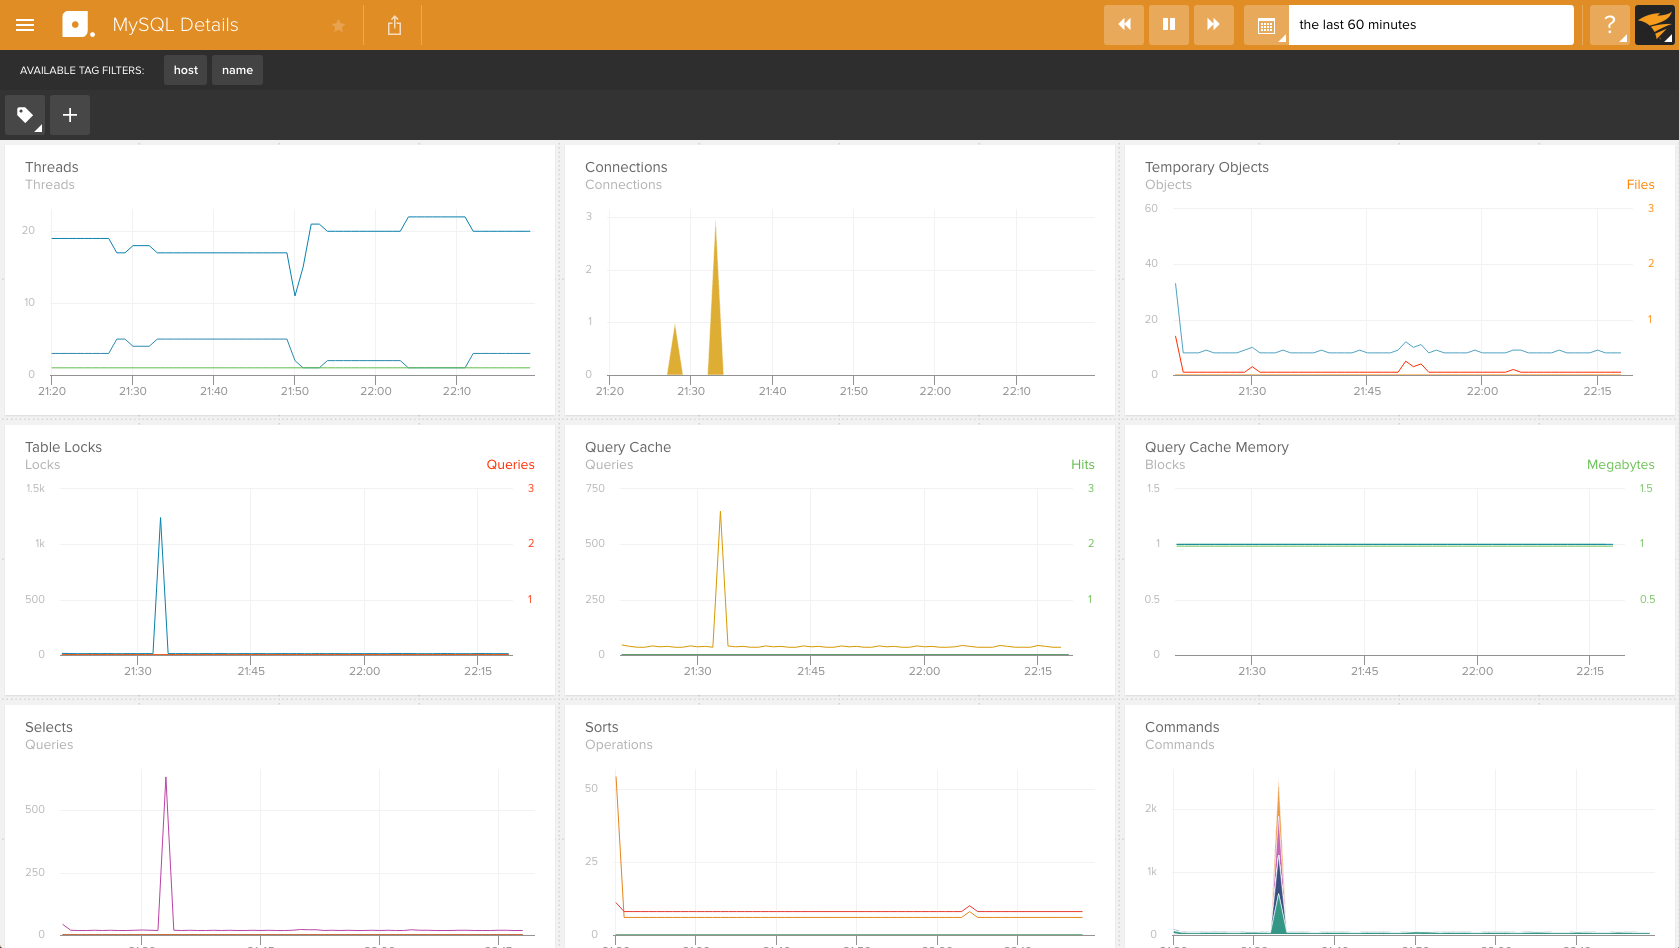
Visit your MySQL preconfigured spaces to observe your new metrics as they stream in. The MySQL Overview dashboard provides a summary view of MySQL health and performance metrics, whereas MySQL Details and MySQL InnoDB enable more in-depth diagnostics and troubleshooting.
MySQL Overview
MySQL Details
MySQL InnoDB
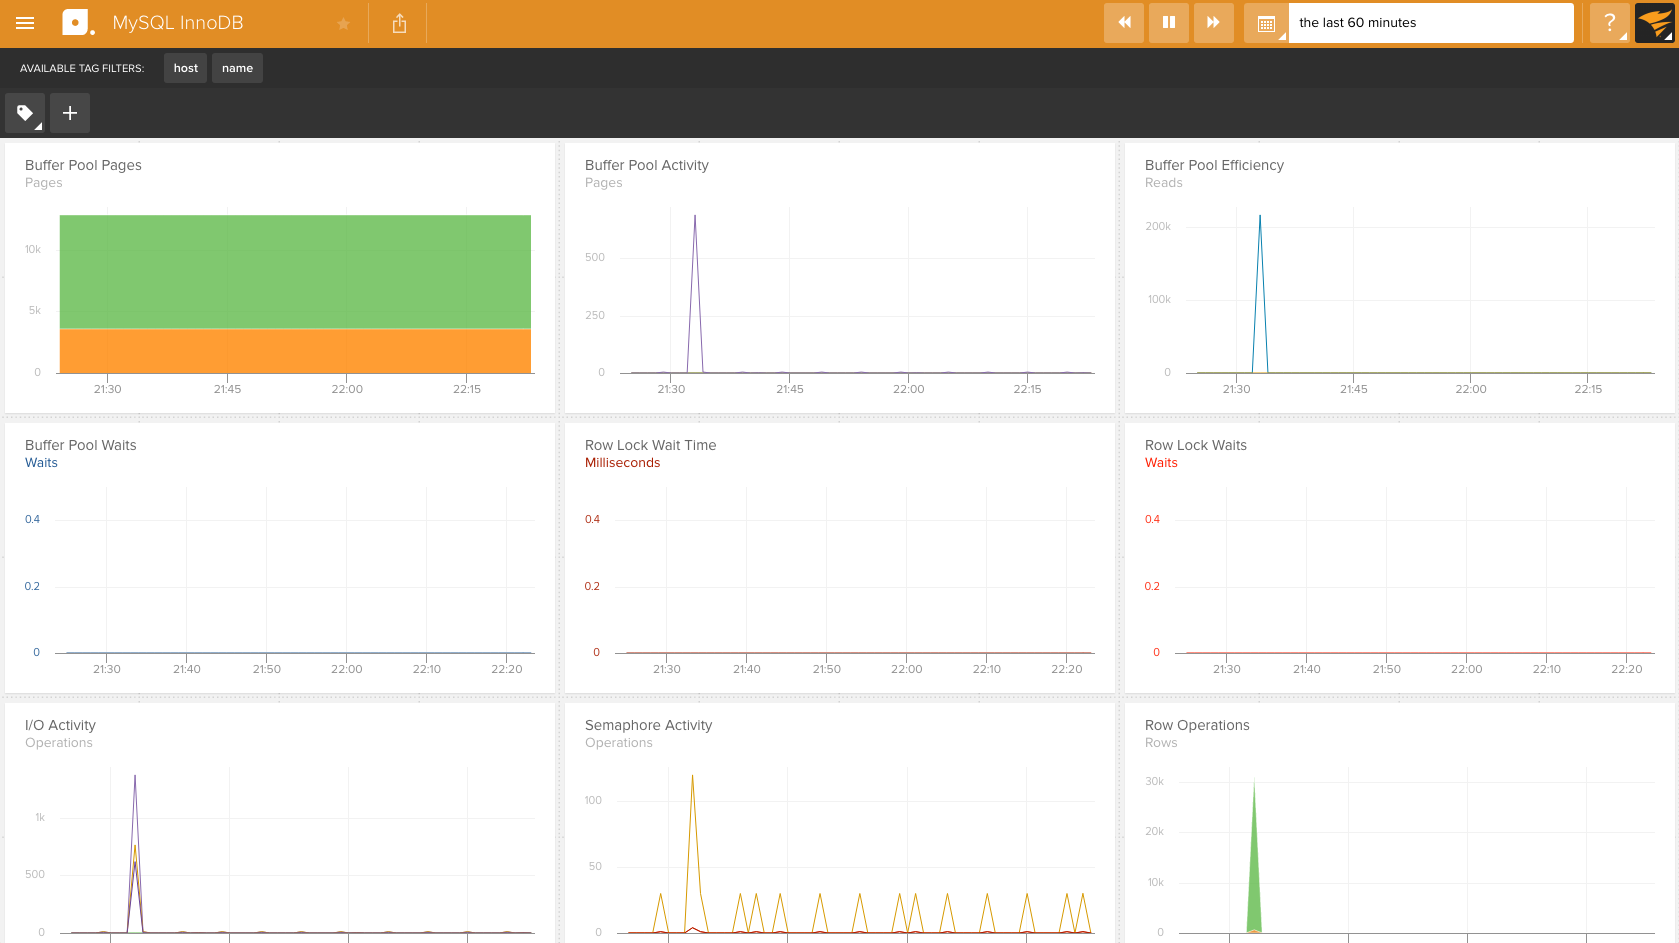
Use our tag bar at the top to filter and/or group your view to a specific MySQL
instance or subset of stream sources. For example, to isolate the view to the
MySQL instance associated with the mydb database, use a filter value of *.mydb
on the host tag.
AWS RDS
Monitoring MySQL instances running on AWS RDS is
very similar, except that you’ll need to install Librato Agent on a separate server or
EC2 instance. Follow the above steps to configure the MySQL plugin on the monitoring
server. `Host` must be set to the IP address or domain name corresponding to the RDS
instance. You should also configure your RDS instance’s security group to permit access
to port 3306 from the monitoring Librato Agent or EC2 instance.
FAQ
For specific answers to Librato Agent questions check out our Librato Agent FAQ.
Please let us know what you think about this integration. We would love to incorporate your feedback and any ideas you have on dashboard design into the ongoing development of our integrations.