
MongoDB
![]()
MongoDB is a popular cross-platform document-oriented database. Classified as a NoSQL database, MongoDB avoids the traditional table-based relational database structure in favor of JSON-like documents with dynamic schemas, making the integration of data in certain types of applications easier and faster.
The Librato Agent allows you to easily monitor MongoDB’s health and performance. We use a custom collectd plugin to gather metrics from your running MongoDB instance(s).
Create the Integration
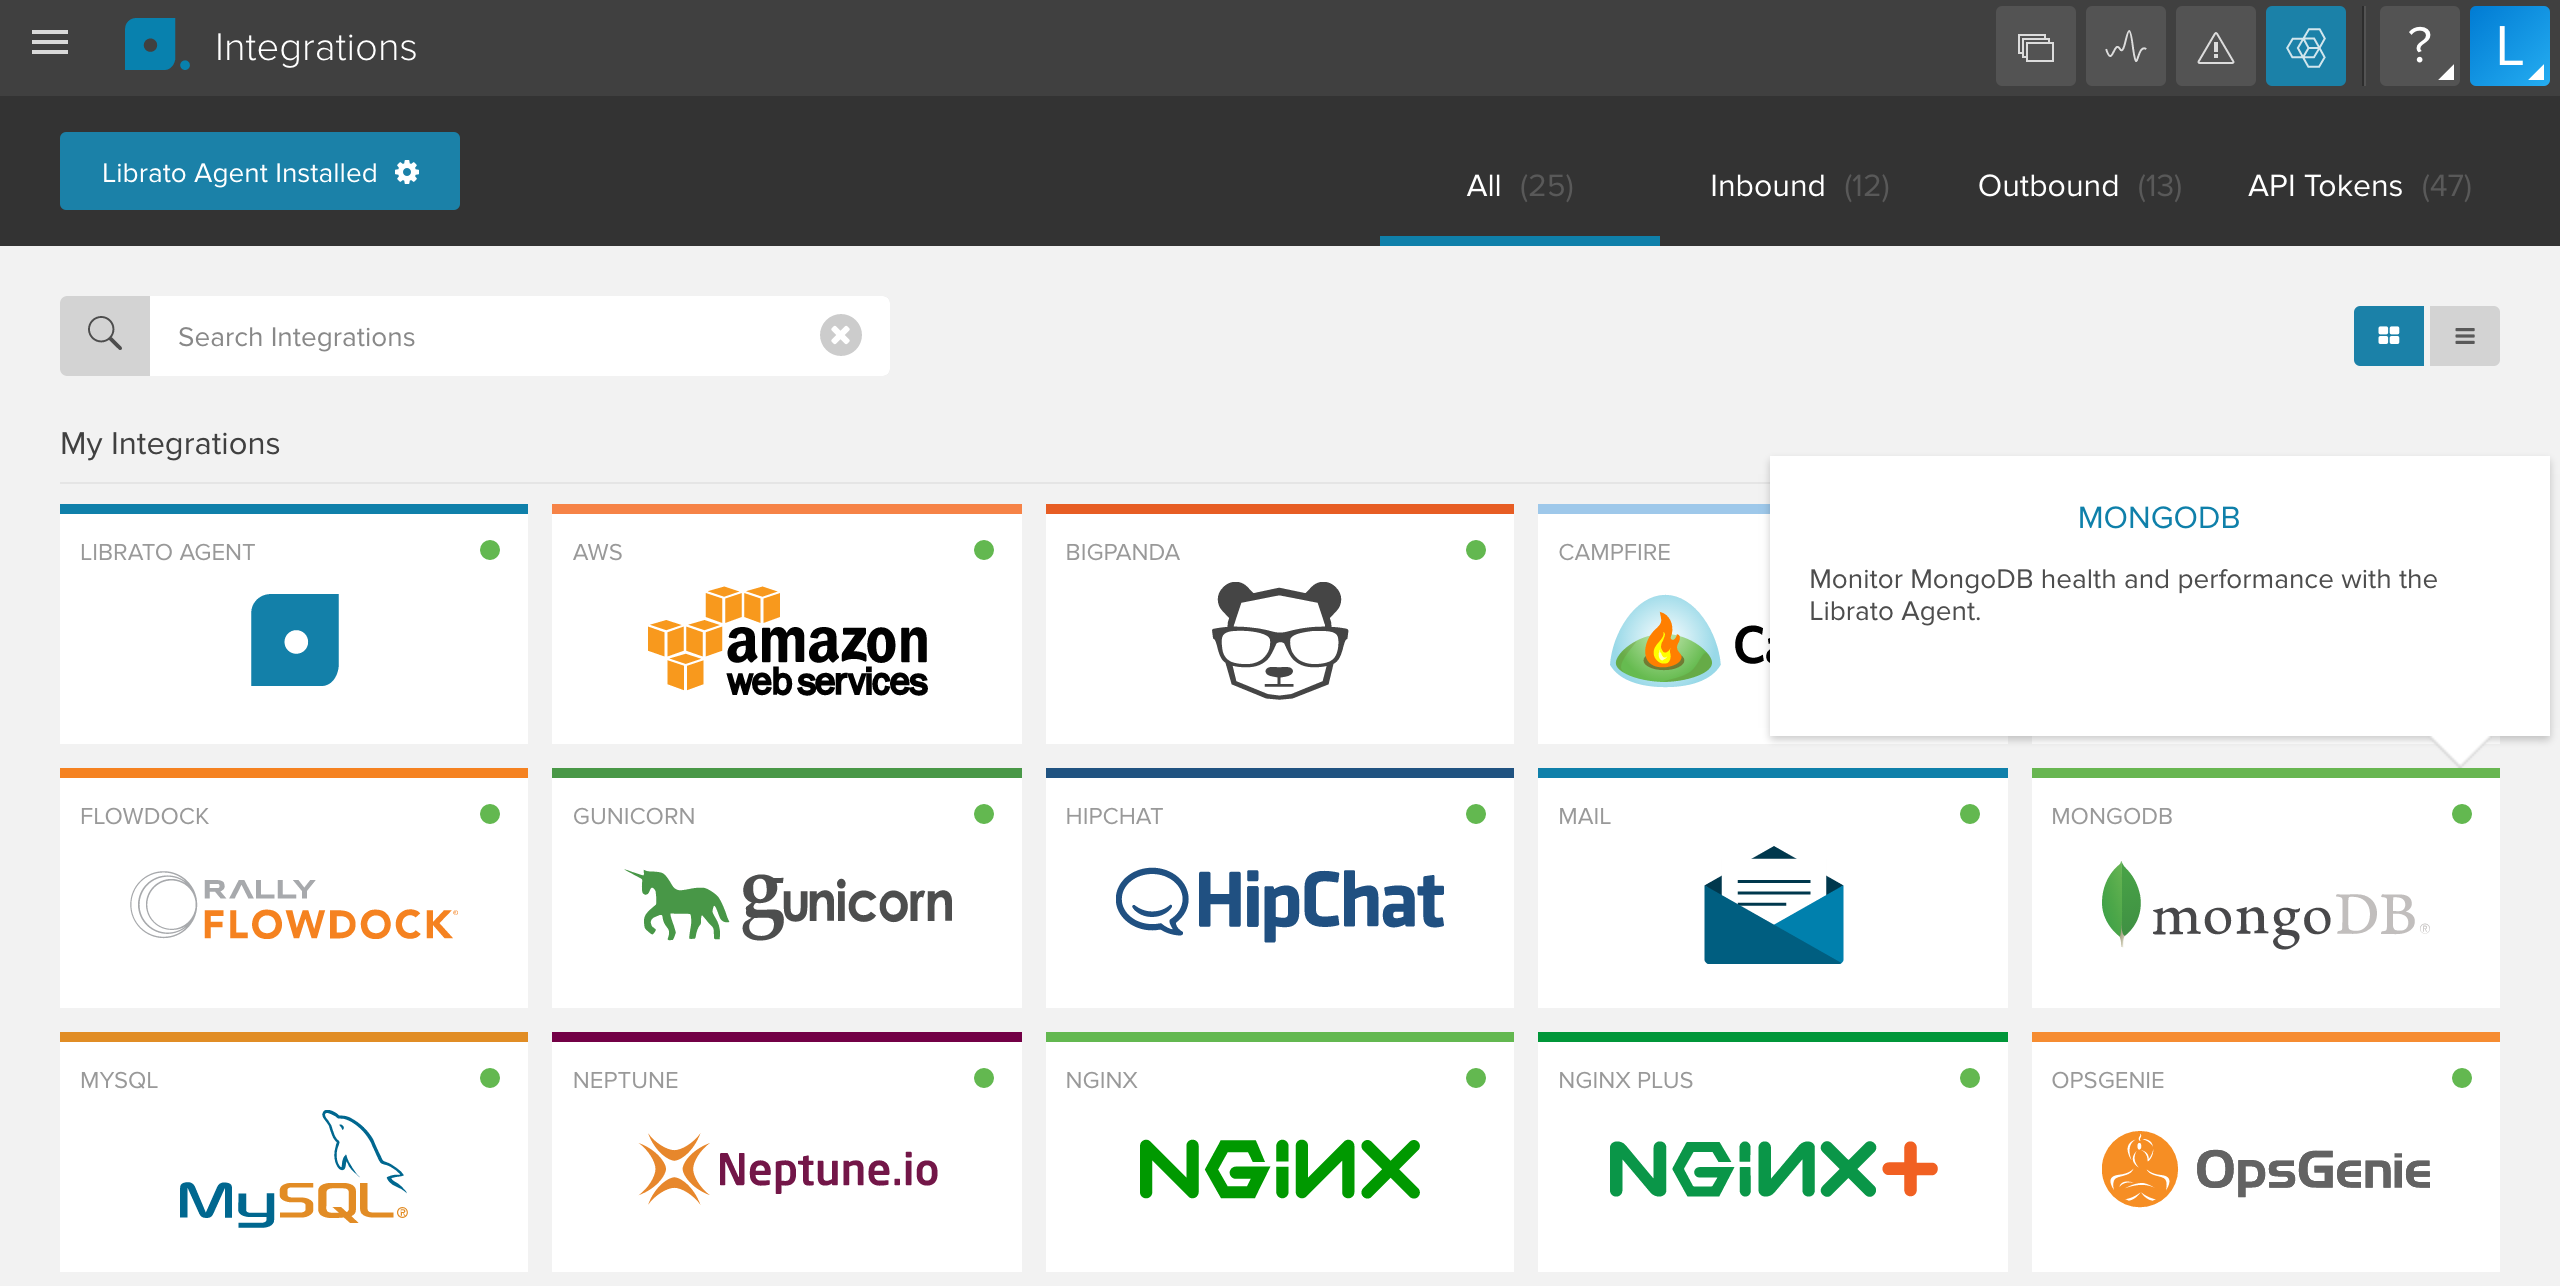
The MongoDB integration depends on the Librato Agent. If you haven’t already, you will first need to install the Librato Agent. Once this is complete, select the MongoDB icon in the integrations catalogue.
Toggle the Enabled switch to activate the MongoDB integration on your Librato account and create the preconfigured MongoDB space.
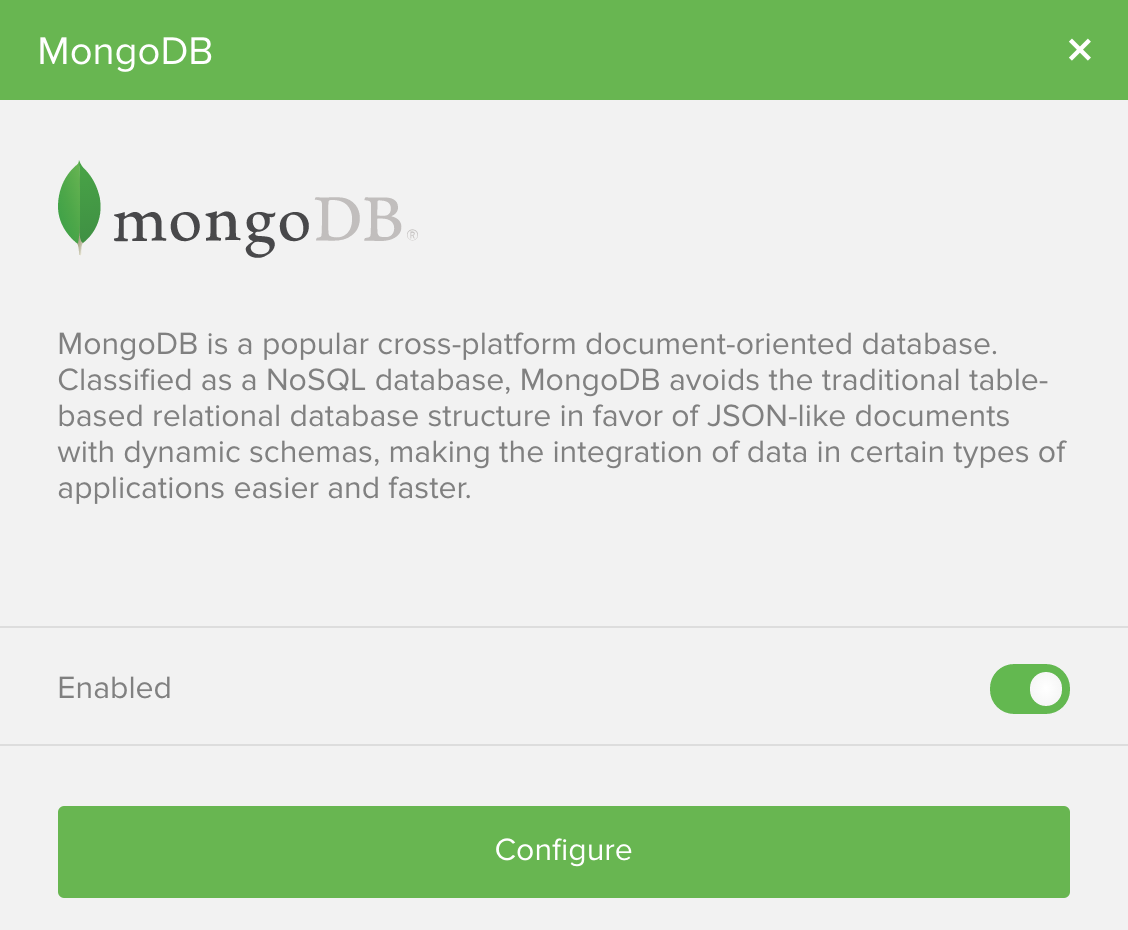
At this point any MongoDB metrics associated with this integration will be allowed through your Librato Agent service-side filters.
Plugin Configuration
Librato Agent provides a default /opt/collectd/etc/collectd.conf.d/mongodb.conf
configuration file, which must be edited to suit your environment.
<LoadPlugin python>
  Globals true
</LoadPlugin>

<Plugin python>
  ModulePath "/opt/collectd/share/collectd"
  ModulePath "/opt/collectd/share/collectd/pymongo.egg"

  Import "collectd-mongodb"

  <Module "collectd-mongodb">
    # Host "127.0.0.1"
    # Port "27017"
    # User "username"
    # Password "password"
    # Database "admin"
    # Name "mongodb"
  </Module>
</Plugin>
If necessary, update Host and Port to the host and port corresponding to
your MongoDB instance. If authenication has been enabled for your MongoDB deployment,
set User and Password to a user who has access to the admin database. Use the
Name configuration parameter to set the plugin instance for the reported metrics,
which is mongodb by default.
By default, the plugin will gather and report storage metrics for the admin
database using the dbstats command. You can use the Database
configuration parameter to instruct the plugin to report storage metrics on other
databases. If specified, Database must be a space-separated list of database names,
starting with admin. For example, to report storage metrics for the database named
orders, configure Database as shown below.
Database "admin" "orders"
Note: You must restart the agent after any changes to your Librato Agent configuration files.
$ sudo service collectd restart
At this point you should begin seeing librato.mongodb.* metrics in your Librato account.
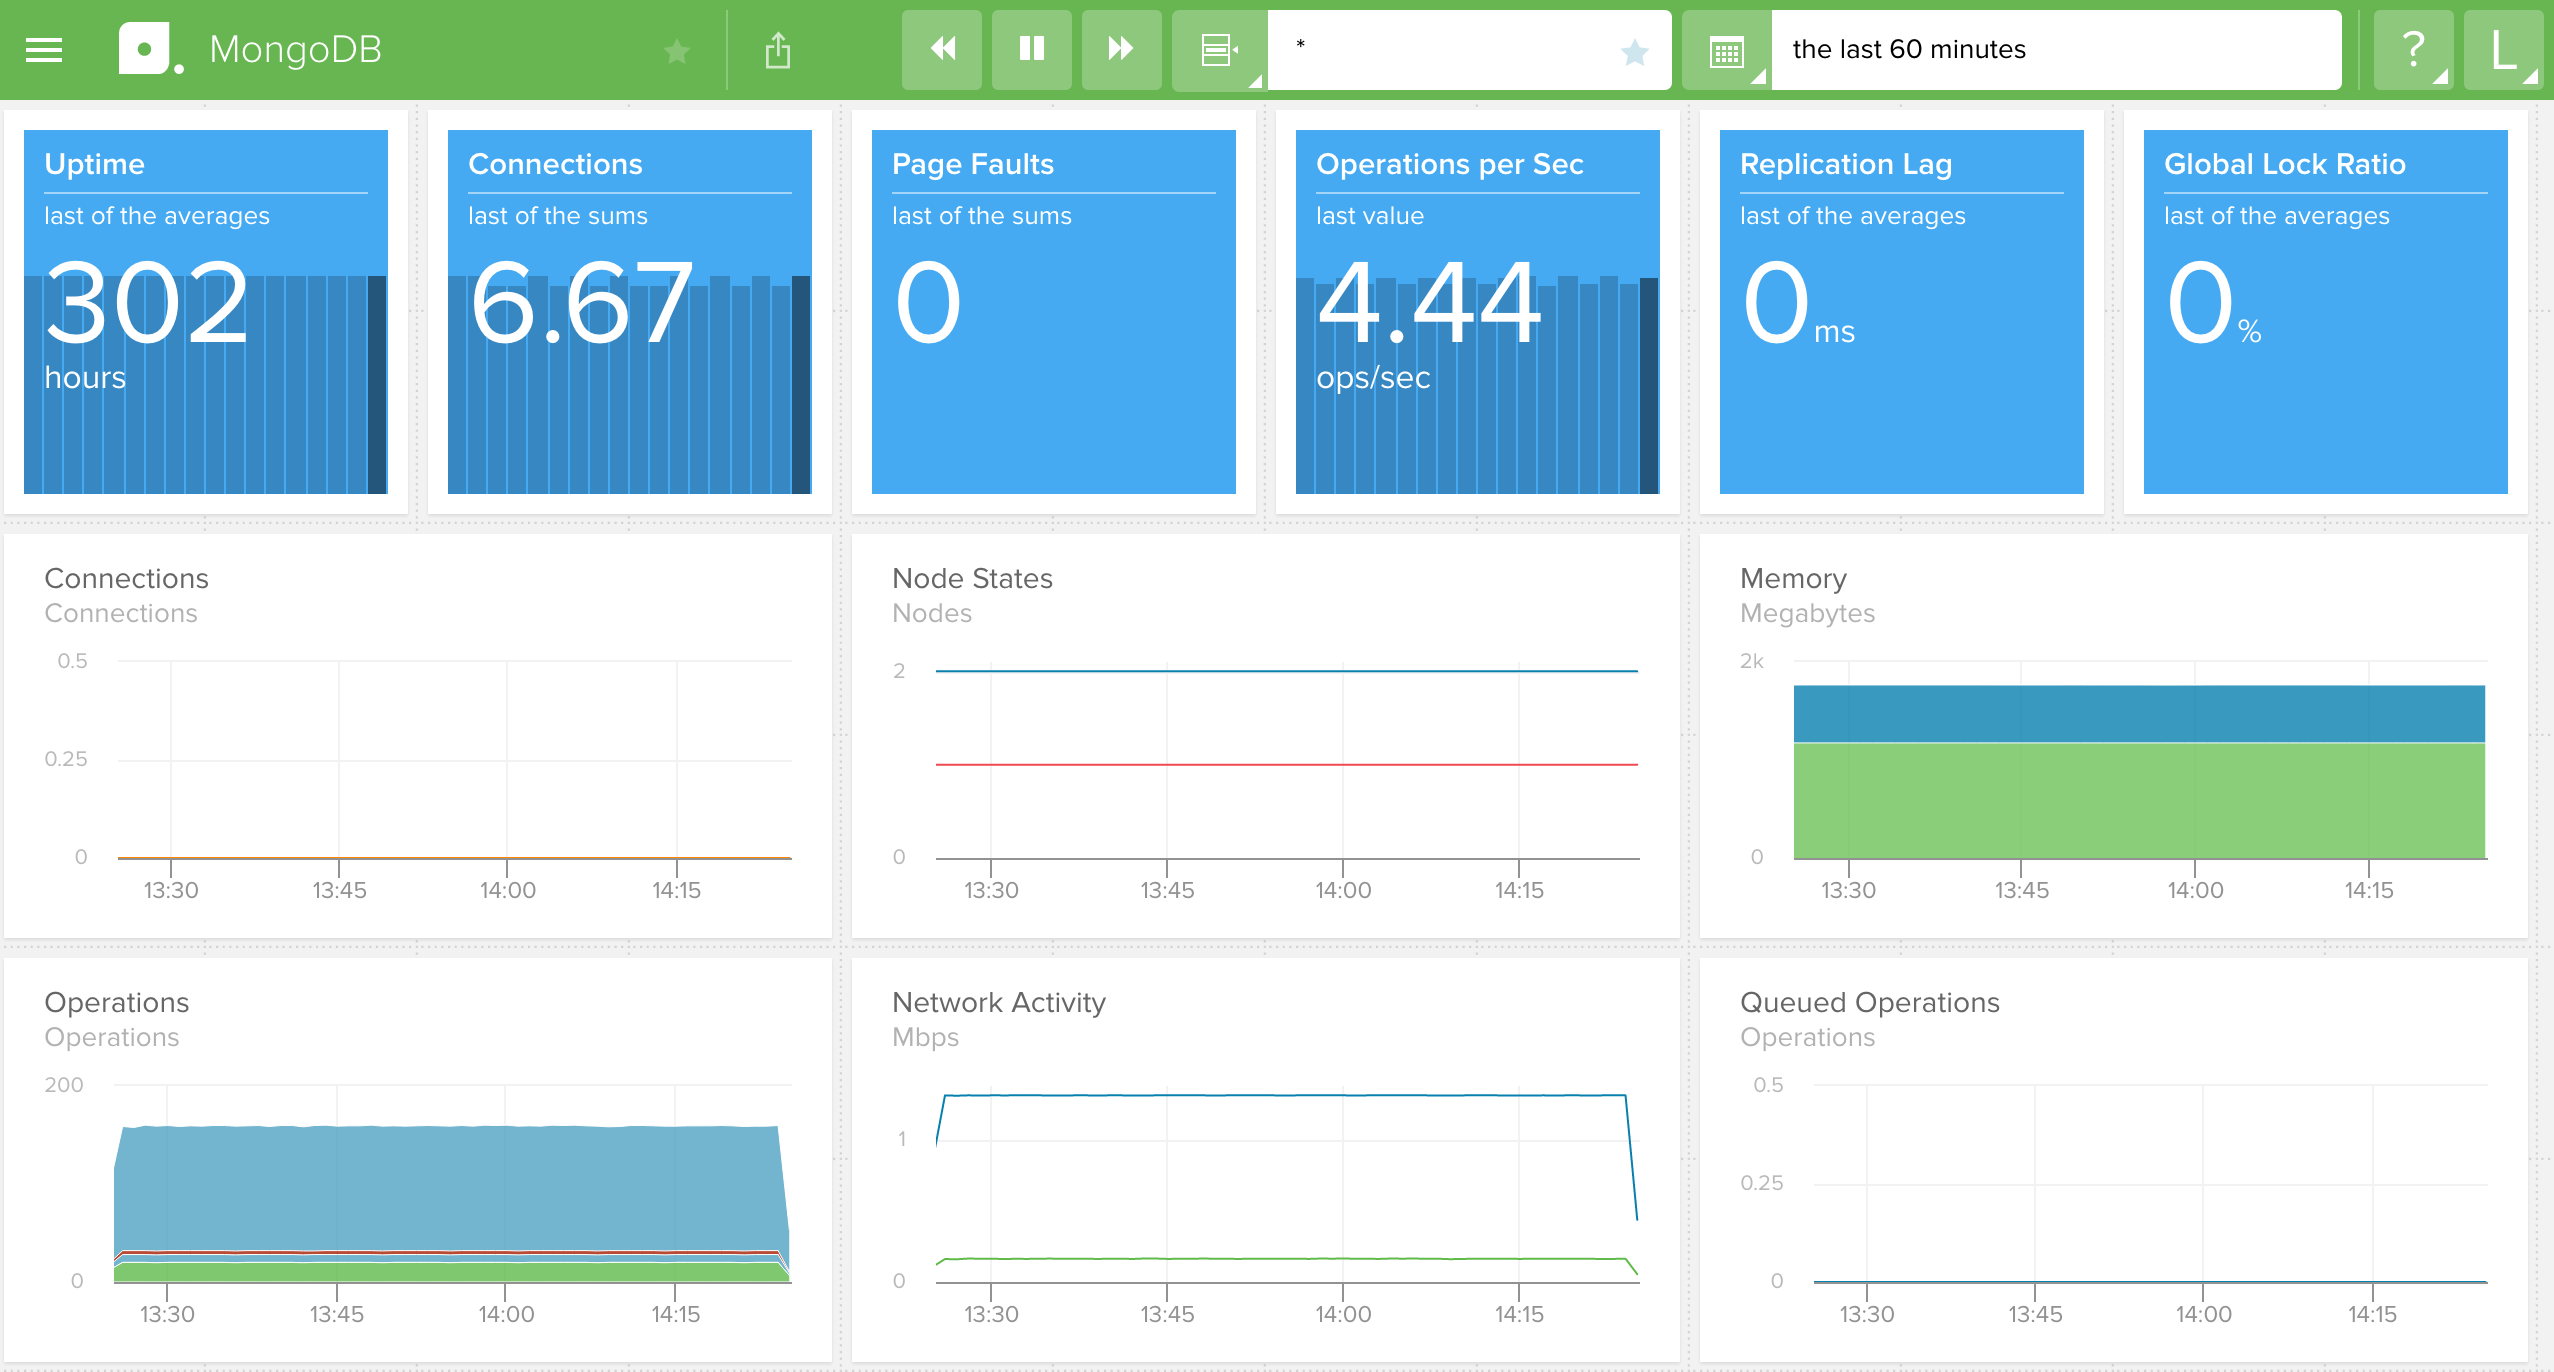
MongoDB Workspace
Visit your MongoDB preconfigured spaces to observe your new metrics as they stream in.
MongoDB Metrics and tags
The MongoDB integration supports the following metrics and tags.
Note: All metrics are prefixed with librato.mongodb..
| Tag Name | Description |
|---|---|
| host | Host name or IP address of monitored server |
| name | The name of the MongoDB database |
Connection statistics
| Description | Name | Tags |
|---|---|---|
| Total connections created | connections.totalCreated | host,name |
| Available connections | connections.available | host,name |
| Current connections | connections.current | host,name |
Operation statistics
| Description | Name | Tags |
|---|---|---|
| Command Operations | total_operations.command | host,name |
| Delete Operations | total_operations.delete | host,name |
| GetMore Operations | total_operations.getmore | host,name |
| Insert Operations | total_operations.insert | host,name |
| Query Operations | total_operations.query | host,name |
| Update Operations | total_operations.update | host,name |
Database statistics
| Description | Name | Tags |
|---|---|---|
| Number of page fauls | page_faults | host,name |
| Total network bytes out | network.bytesIn | host,name |
| Total network bytes out | network.bytesOut | host,name |
| Total number of requests | network.numRequests | host,name |
| Message asserts raised | asserts.msg | host,name |
| Regular asserts raised | asserts.regular | host,name |
| Rollover asserts raised | asserts.rollovers | host,name |
| User asserts raised | asserts.user | host,name |
| Warnign asserts raised | asserts.warning | host,name |
FAQ
For specific answers to Librato Agent questions check out our Librato Agent FAQ.
Please let us know what you think about this integration. We would love to incorporate your feedback and any ideas you have on dashboard design into the ongoing development of our integrations.