
Docker
Docker is a virtualization technology designed to help package and run software applications within lightweight guest containers. It gives developers and operations teams the ability to quickly prototype, deploy, and replace software versions using a common toolbox.
The Librato Agent allows you to easily monitor the health of your Docker containers from the host operating system. Our custom plugin gathers statistics exposed by the Docker API and emits them to your Librato account with your other server metrics. It will even capture each container’s unique identifier and append it to the metric’s Dynamic Tags.
Installation
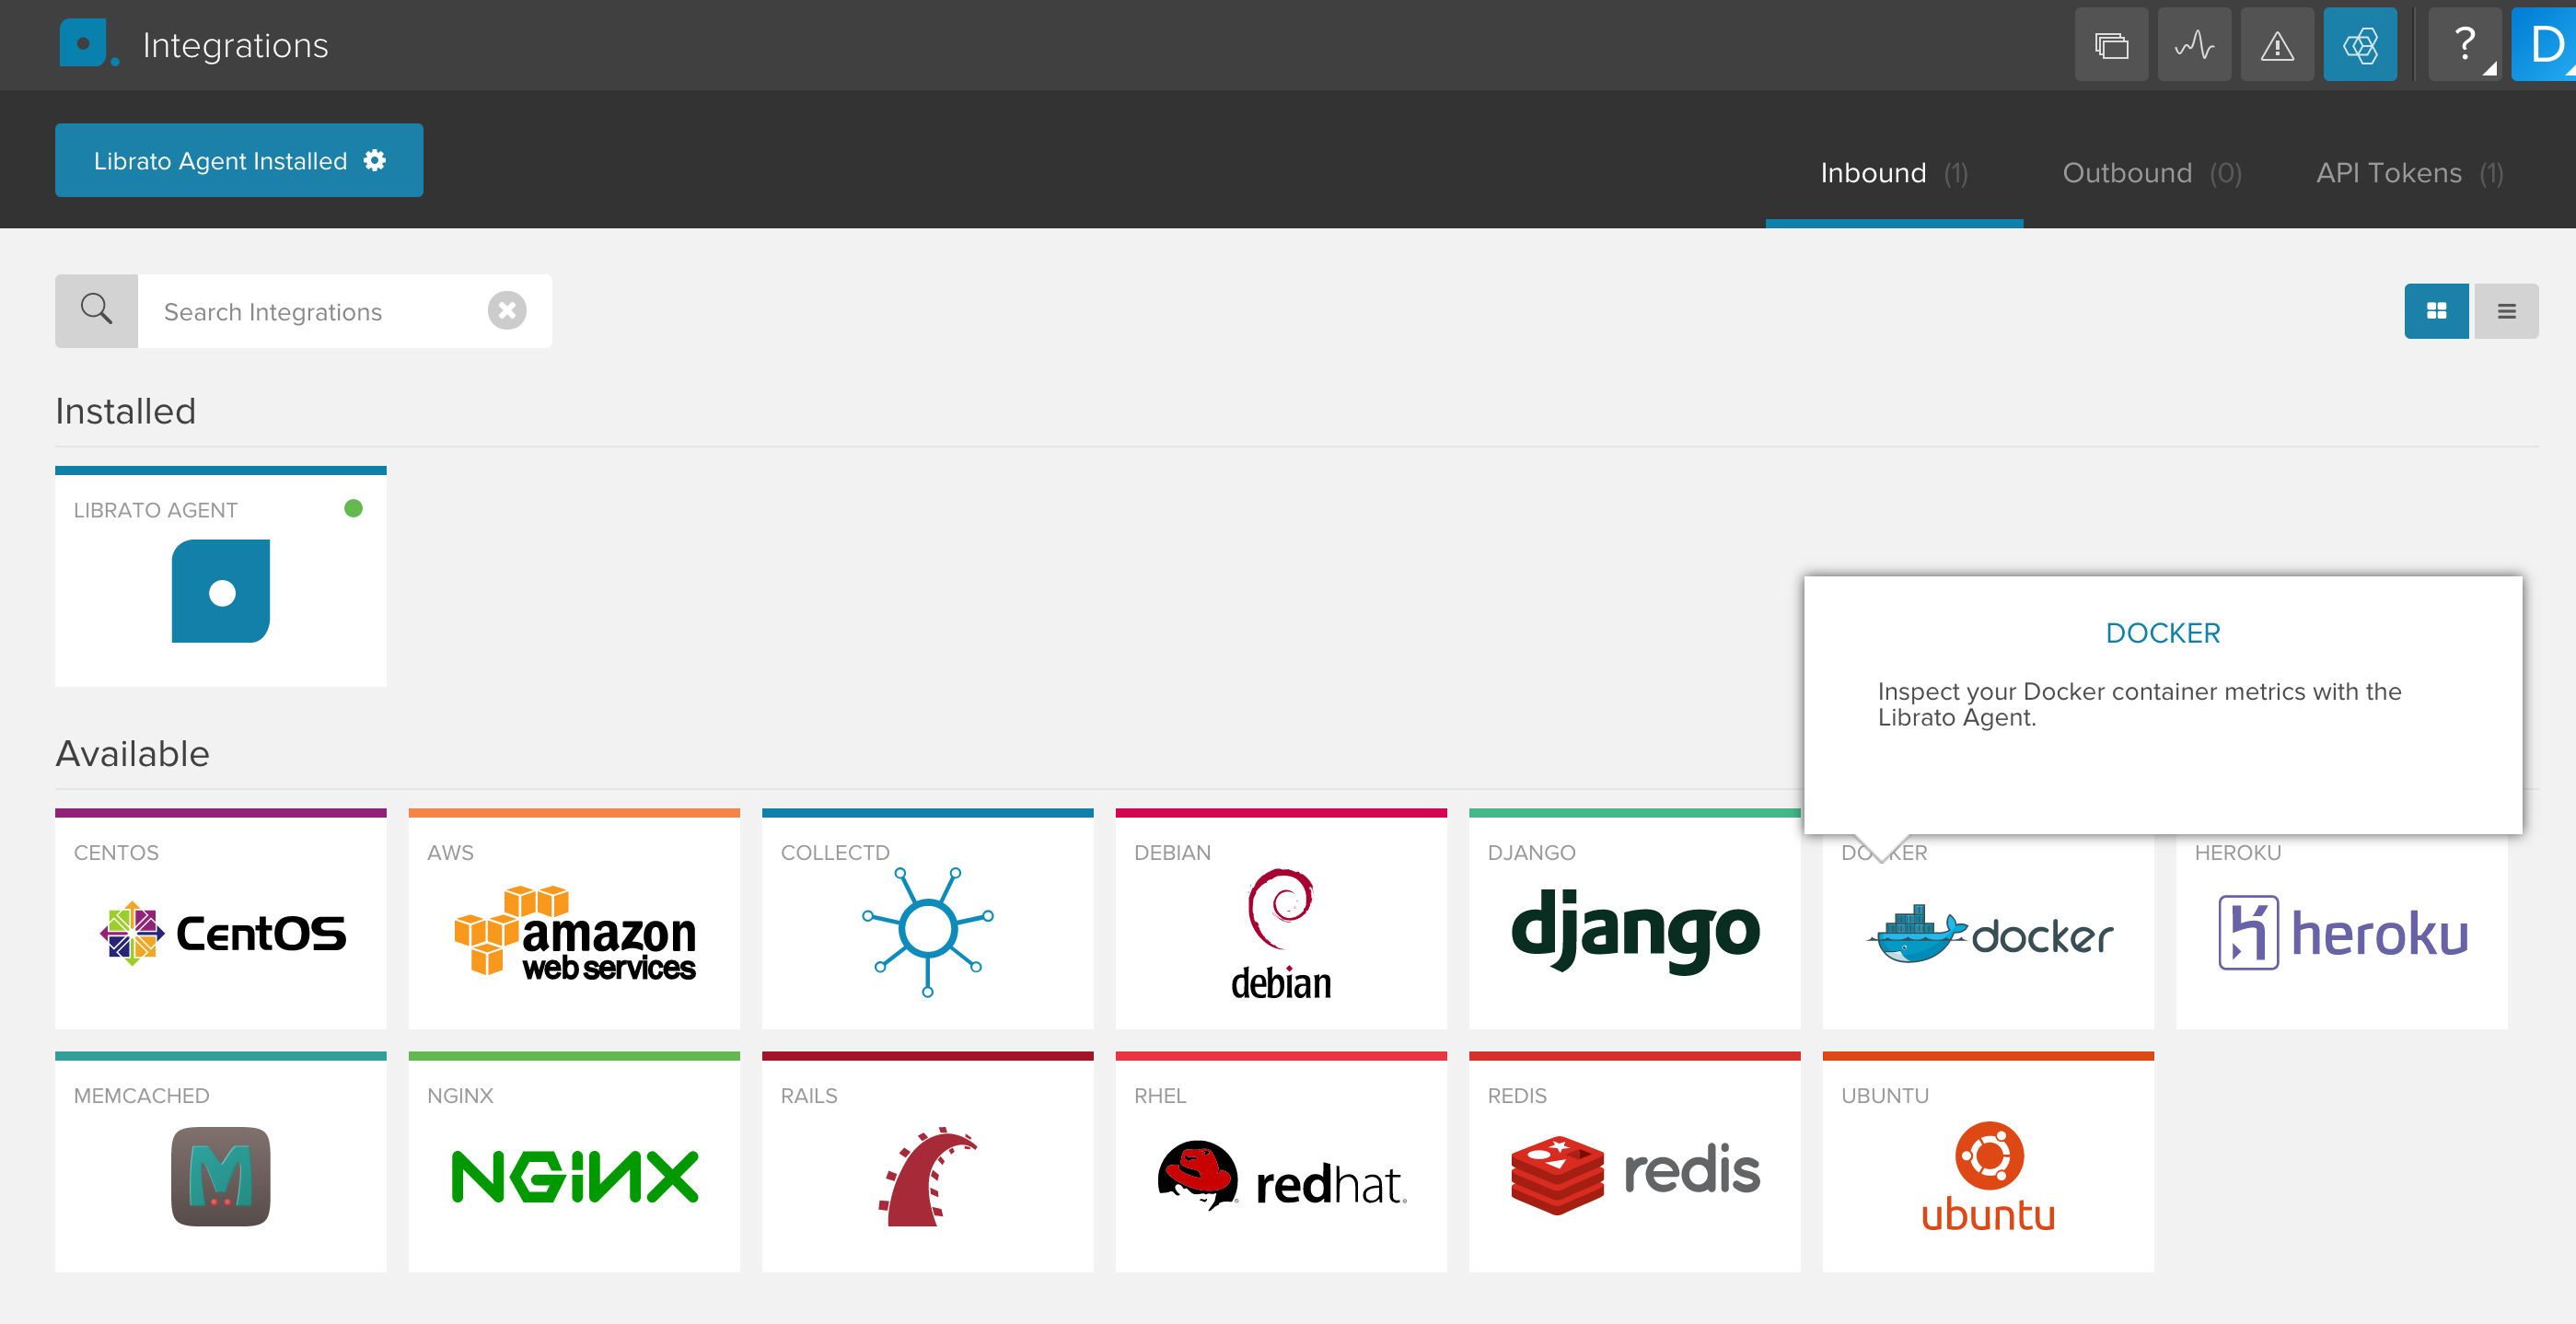
The Docker integration depends on the Librato Agent. If you haven’t already, you will first need to install the Librato Agent. Once this is complete, select the Docker icon in the integrations catalogue.
Toggle the Enabled switch to activate the Docker integration on your Librato account and create the preconfigured Docker Space.
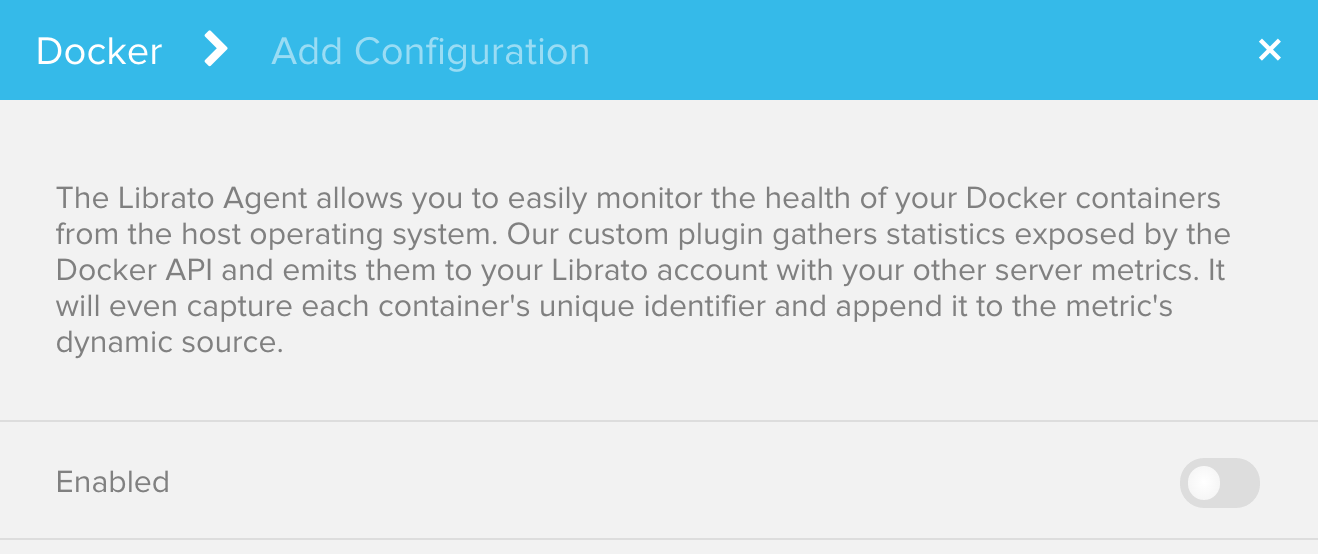
At this point your integration is complete and any Docker metrics associated with this integration will be allowed through your Librato Agent service-side filters.
Plugin Configuration
Read-only access to the Docker socket
By default, the Docker
API
listens on a UNIX socket at /var/run/docker.sock. The Librato Agent’s
Docker plugin gathers metrics from this socket, but it
needs access to read from the file. We suggest using the unprivileged
system nobody user, and have configured the plugin accordingly.
This user will need to be added to your docker system group.
$ sudo usermod -a -G docker nobody
Optional TCP socket listener
Alternatively, the plugin can query the Docker API over HTTP. Your
Docker service will need to be configured to listen on a TCP port.
Once this is complete, simply add the location as an HTTP url in your
Docker plugin configuration file. For example, if your Docker API is
listening on localhost port 2375, your /opt/collectd/etc/collectd.conf.d/docker.conf
file should contain the following Exec line:
Exec "nobody" "/opt/collectd/share/collectd/collectd-docker.py" "http://127.0.0.1:2375"
Note: You must restart the agent after any changes to the Librato Agent configuration files.
$ sudo service collectd restart
At this point you should begin seeing librato.docker.* metrics in your
Librato account.
Filtering by Container ID
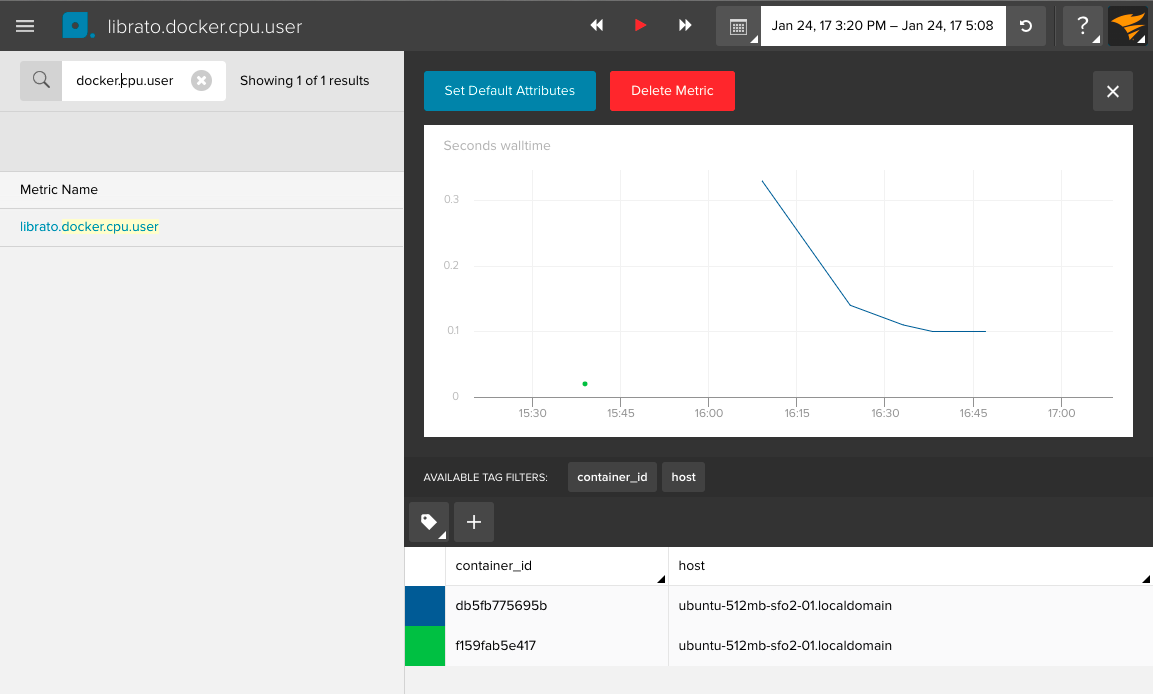
This plugin is optimized for the Librato monitoring service. Besides simply gathering all of the container-level health metrics made available via Docker’s stats API, we normalize the metrics so that the container ID is included as a tag. This makes it easy to filter across your fleet of containerized services.
Docker Workspace
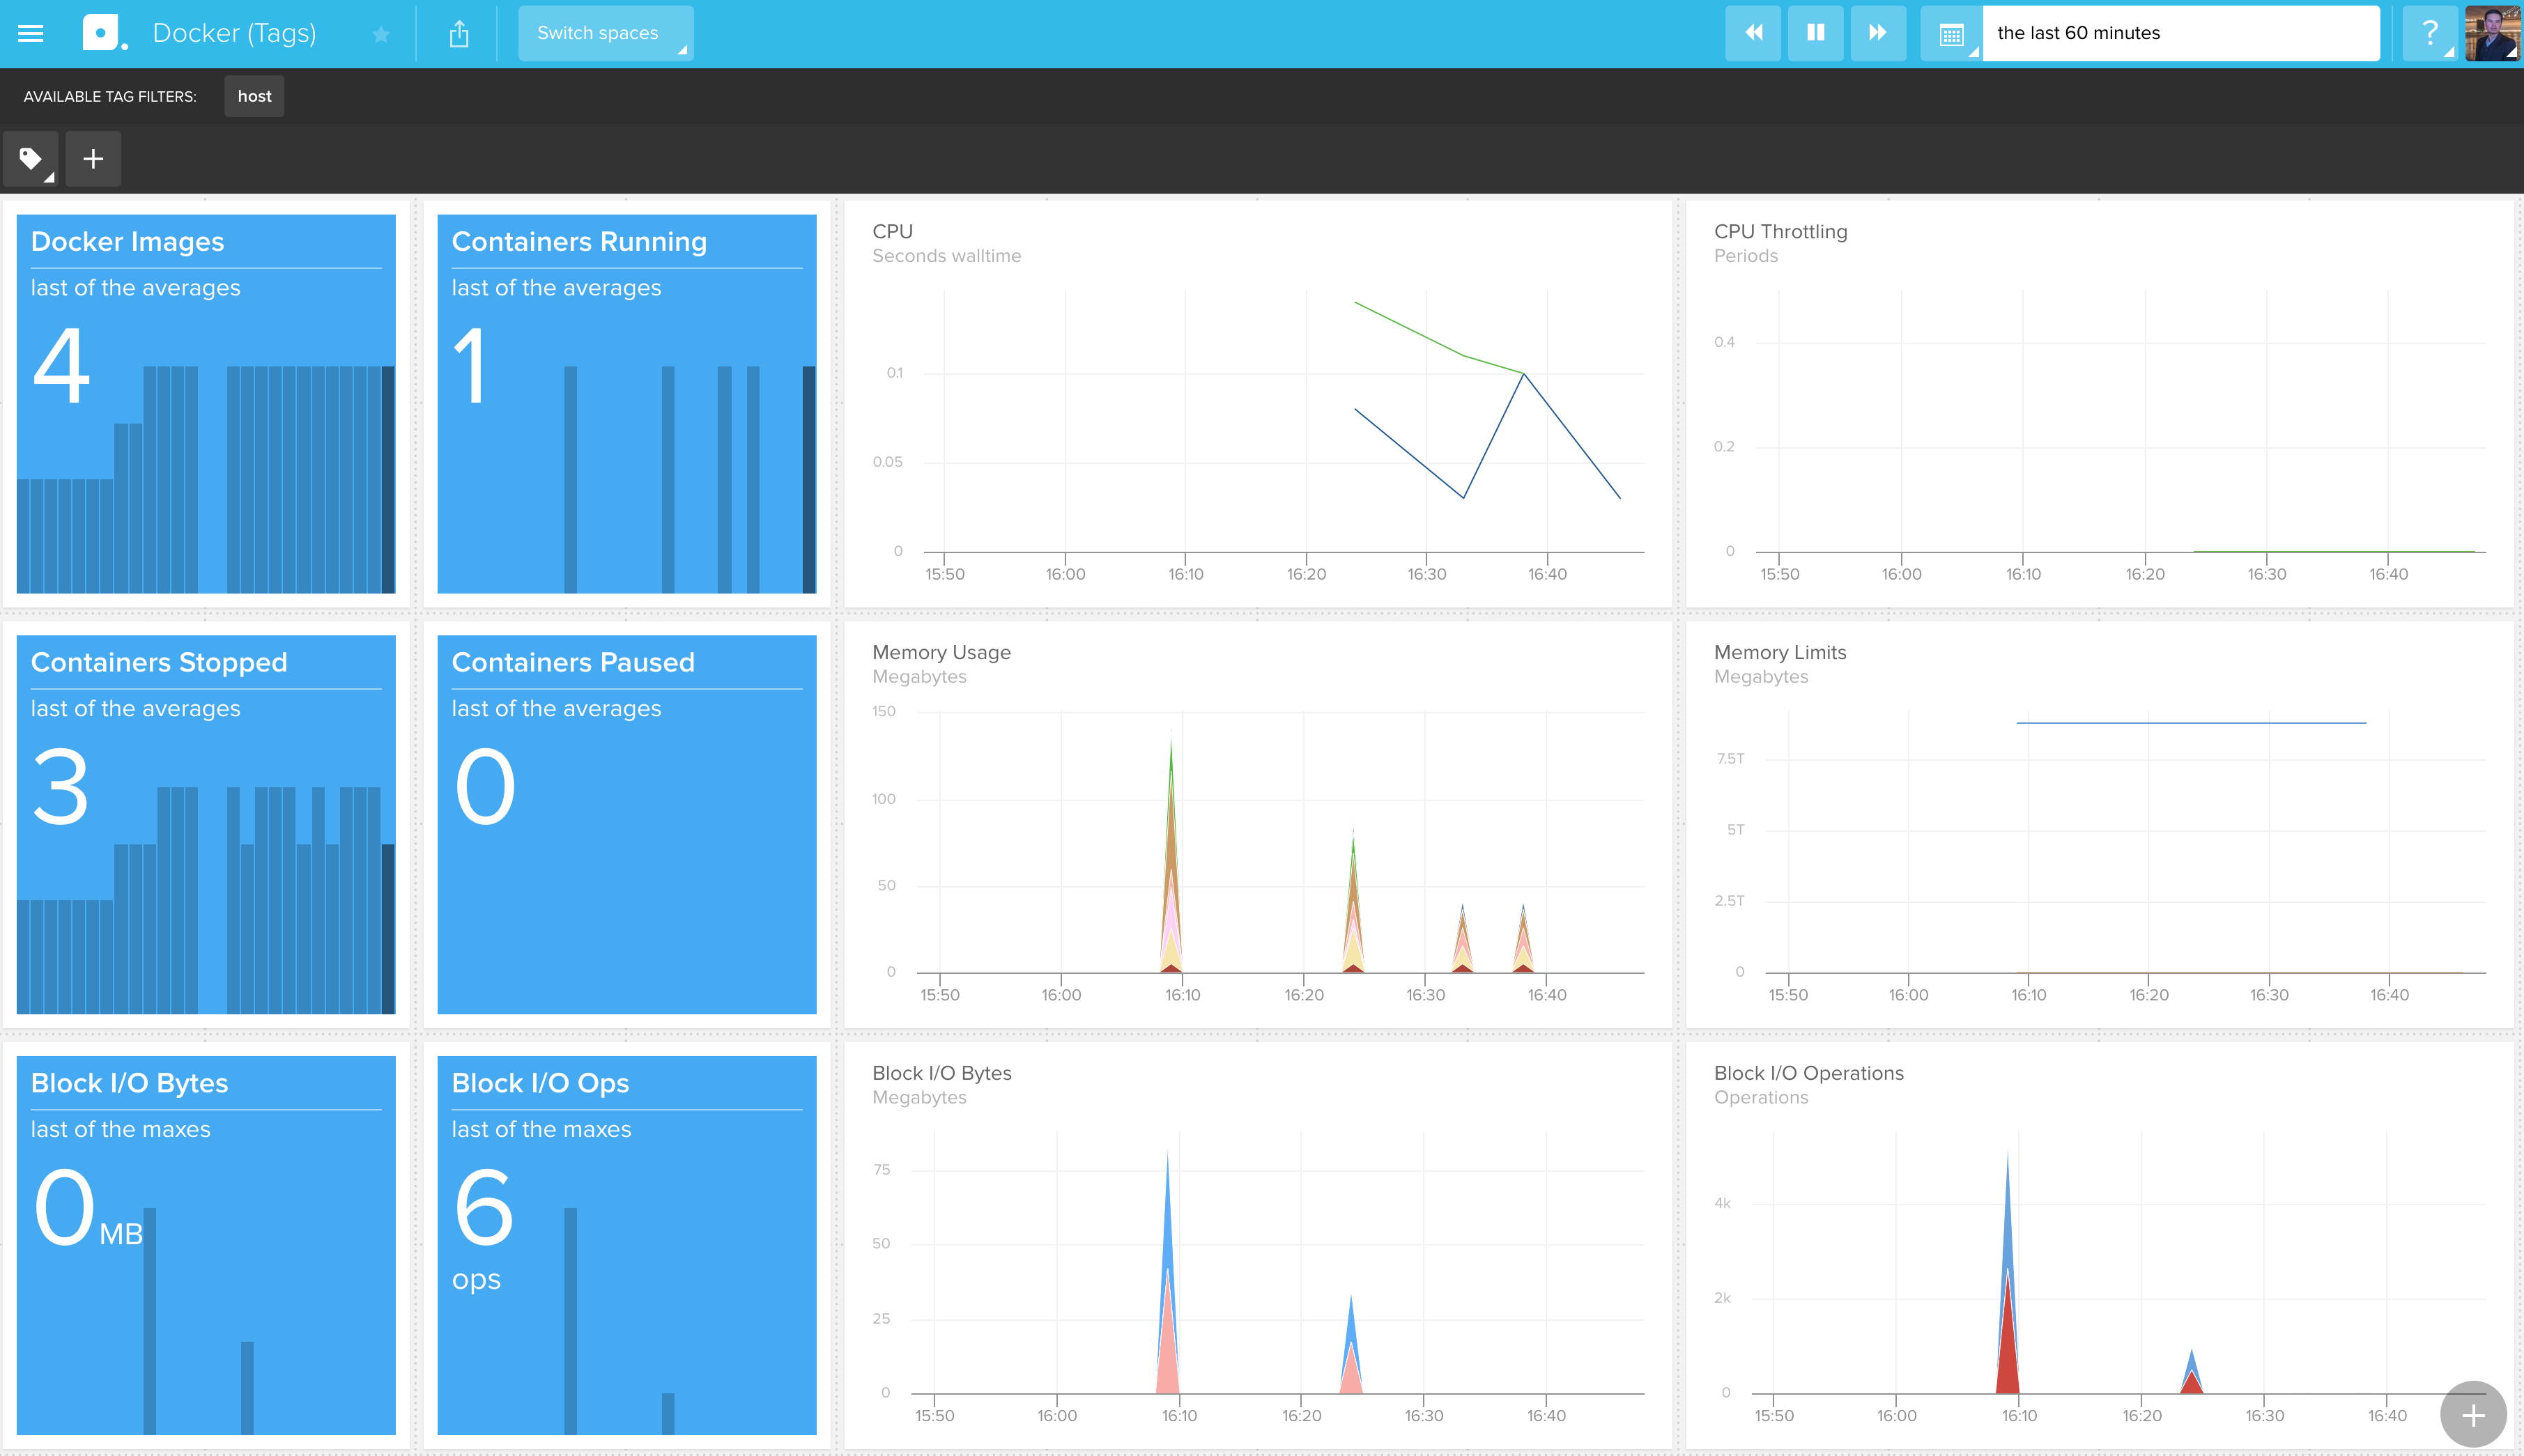
Visit your preconfigured Space to observe your new metrics as they stream in. You can use our available tag filters at the top left to group by and filter your metric streams. For example, you may want to isolate the view to a specific group of web servers or even to an individual container that is behaving badly.
Memory Metrics (memory.stat)
Per the Docker documentation, memory metrics are found in the “memory” cgroup.
Note that the memory control group adds a little overhead, because it does very
fine-grained accounting of the memory usage on your host. Therefore, many distros
chose to not enable it by default. Generally, to enable it, all you have to do is
add kernel command-line parameters: cgroup_enable=memory swapaccount=1
If your kernel supports cgroup_enable, you would add this at boot time. For instance, on an Ubuntu machine:
Edit /etc/default/grub
Update GRUB_CMDLINE_LINUX as follows:
GRUB_CMDLINE_LINUX="cgroup_enable=memory"
Then run sudo update-grub and reboot.
If you are using CoreOS, it is already available.
Troubleshooting
If Docker metrics don’t start flowing automatically, check to see if you have Python installed on your machine. Python is required to collect Docker metrics.
For specific answers to Librato Agent questions check out our Librato Agent FAQ.
Please let us know what you think about this integration. We would love to incorporate your feedback and any ideas you have on dashboard design into the ongoing development of our integrations.