AWS CloudWatch: Elastic Beanstalk enhanced health metrics
Overview
Elastic Beanstalk helps you deploy and manage applications in the AWS cloud without having to manage the individual AWS infrastructure services that comprise the application stack. Developers can upload their application, and Elastic Beanstalk automatically handles the details of capacity provisioning, load balancing, scaling, and application health monitoring. Starting with platform version 2.0, Elastic Beanstalk supports enhanced health metric reporting to AWS CloudWatch.
Enabling the Elastic Beanstalk service in your Librato CloudWatch Integration will import all of your enhanced health metrics into your Librato account and preconfigured AWS Elastic Beanstalk space.
Requirements
Enhanced health reporting requires a version 2 or newer platform configuration and is supported by all platforms except Windows Server with IIS. It requires two roles: a service role for Elastic Beanstalk and an instance profile for the environment. The service role allows Elastic Beanstalk to interact with other AWS services on your behalf in order to gather information about the resources in your environment. The instance profile allows the instances in your environment to write logs to Amazon S3. When you create an Elastic Beanstalk environment in the AWS Management Console, the console prompts you to create an instance profile and service role with appropriate permissions.
Sample Service Role
{
  "Version": "2012-10-17",
  "Statement": [
    {
      "Effect": "Allow",
      "Action": [
          "elasticloadbalancing:DescribeInstanceHealth",
          "elasticbeanstalk:DescribeEnvironments",
          "ec2:DescribeInstances",
          "ec2:DescribeInstanceStatus",
          "ec2:GetConsoleOutput",
          "ec2:AssociateAddress",
          "ec2:DescribeAddresses",
          "ec2:DescribeSecurityGroups",
          "sqs:GetQueueAttributes",
          "sqs:GetQueueUrl",
          "autoscaling:DescribeAutoScalingGroups",
          "autoscaling:DescribeAutoScalingInstances",
          "autoscaling:DescribeScalingActivities",
          "autoscaling:DescribeNotificationConfigurations"
      ],
      "Resource": [
          "*"
      ]
    }
  ]
}
Sample Instance Role
{
  "Version": "2012-10-17",
  "Statement": [
    {
      "Effect": "Allow",
      "Action": [
        "elasticbeanstalk:Check*",
        "elasticbeanstalk:Describe*",
        "elasticbeanstalk:List*",
        "elasticbeanstalk:RequestEnvironmentInfo",
        "elasticbeanstalk:RetrieveEnvironmentInfo",
        "ec2:Describe*",
        "elasticloadbalancing:Describe*",
        "autoscaling:Describe*",
        "cloudwatch:Describe*",
        "cloudwatch:List*",
        "cloudwatch:Get*",
        "s3:Get*",
        "s3:List*",
        "sns:Get*",
        "sns:List*",
        "cloudformation:Describe*",
        "cloudformation:Get*",
        "cloudformation:List*",
        "cloudformation:Validate*",
        "cloudformation:Estimate*",
        "rds:Describe*",
        "sqs:Get*",
        "sqs:List*"
      ],
      "Resource": "*"
    }
  ]
}
Librato IAM User
In addition to the aforementioned service and instance roles used by CloudWatch, you will also need to update your IAM user for Librato to include the elasticbeanstalk:DescribeEnvironments policy action. For the most recent version of our recommended CloudWatch policy, please refer to our AWS CloudWatch: Setup document.
Configuration
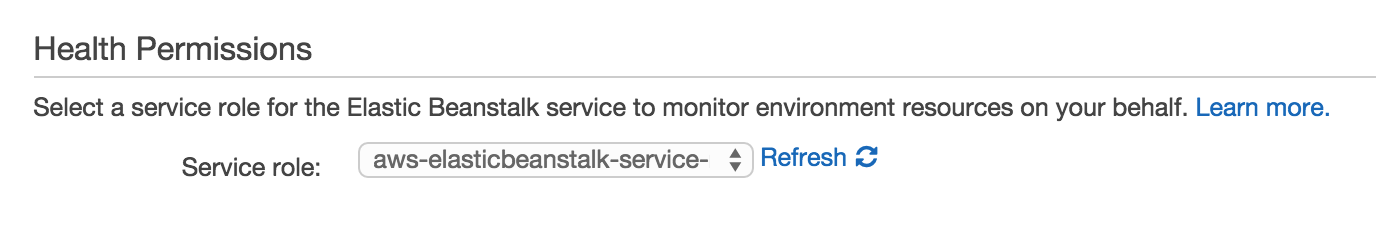
Each Elastic Beanstalk environment must be configured with the correct service role. Inside your Configuration tab, click on the Health section to view your settings. Make sure your Service role is set to the correct role.
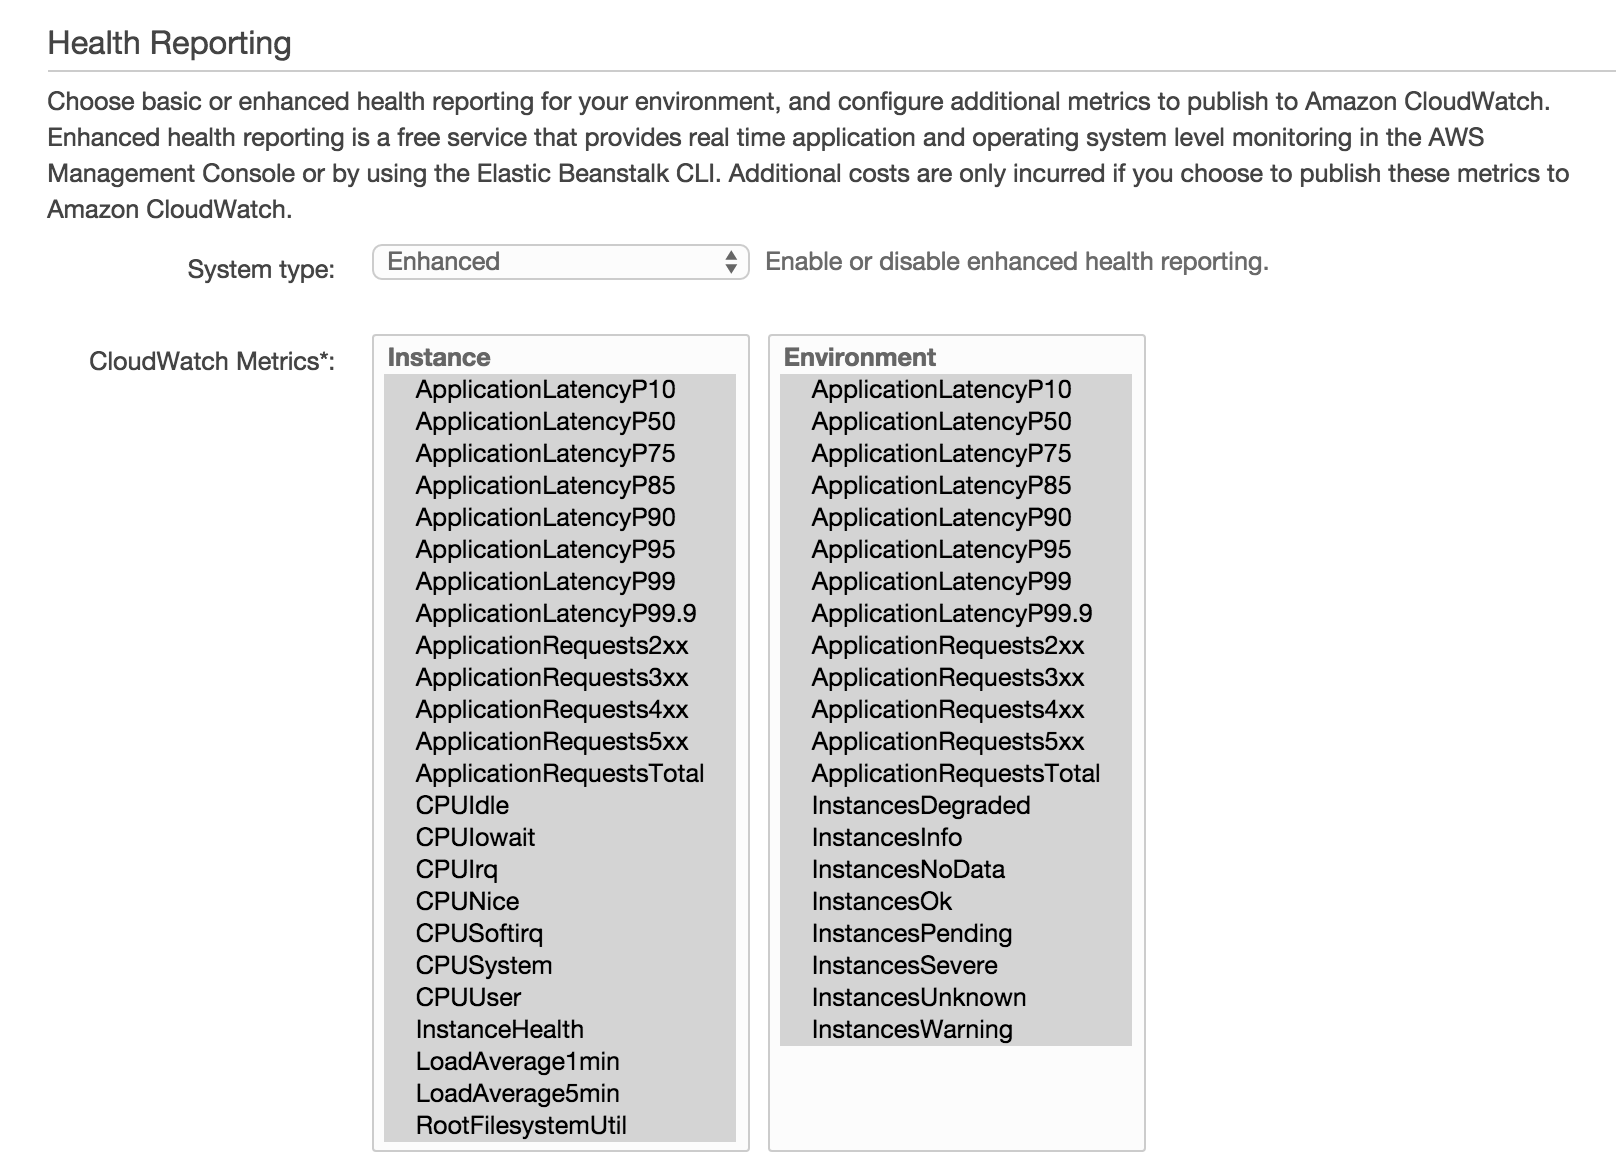
Next, your System type must be set to Enhanced. If this option is unavailable, it likely means that your platform is not at least version 2.0 and will not support enhanced health metrics. You will need to upgrade your platform before continuing. Once this is all complete you will need to select the Instance and/or Environment metrics that you want CloudWatch to gather from your Elastic Beanstalk environment and instances. A number of the metrics are reported with both dimensions (e.g. ApplicationLatencyP95), although the ones tagged for Environment represent the aggregate across the entire environment, while the Instance ones are reported separately for each EC2 instance in your cluster.
Finishing Up
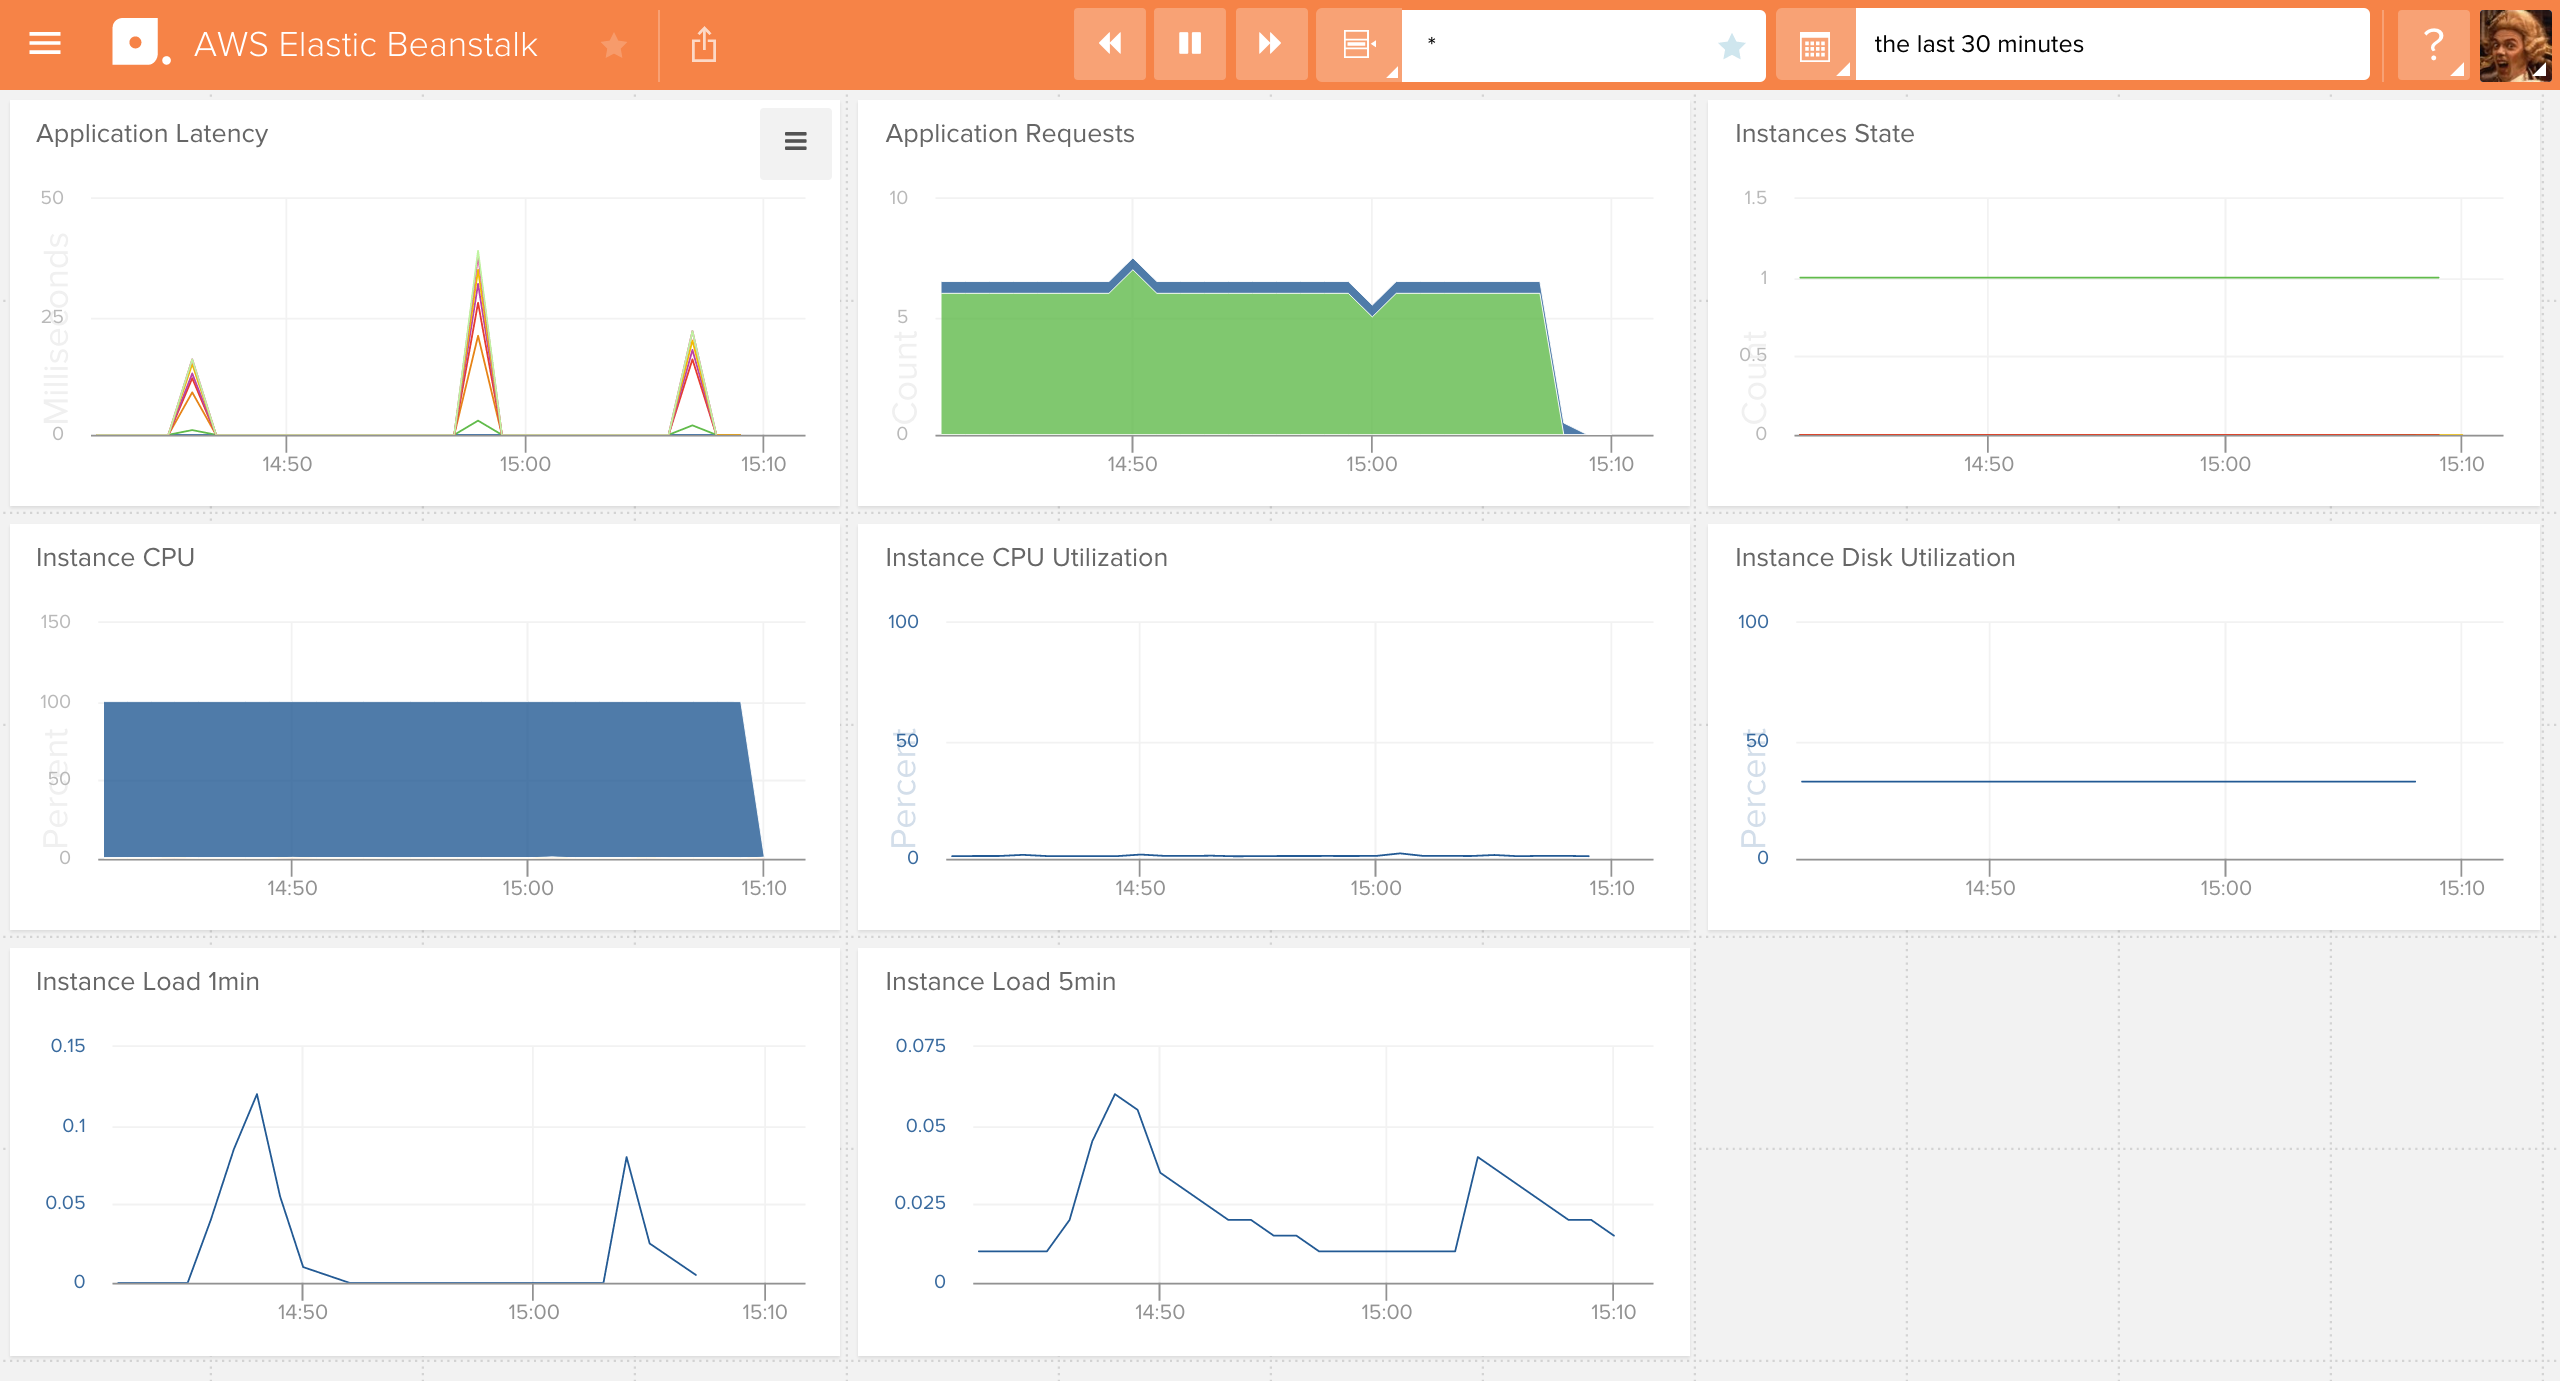
Once you’ve applied your preferences, you should begin seeing these
metrics in your Librato account within a few minutes. In contrast to
most other CloudWatch-enabled AWS services, these metrics are pulled
into CloudWatch as custom metrics. As such, they’re subject to
CloudWatch custom metrics pricing.
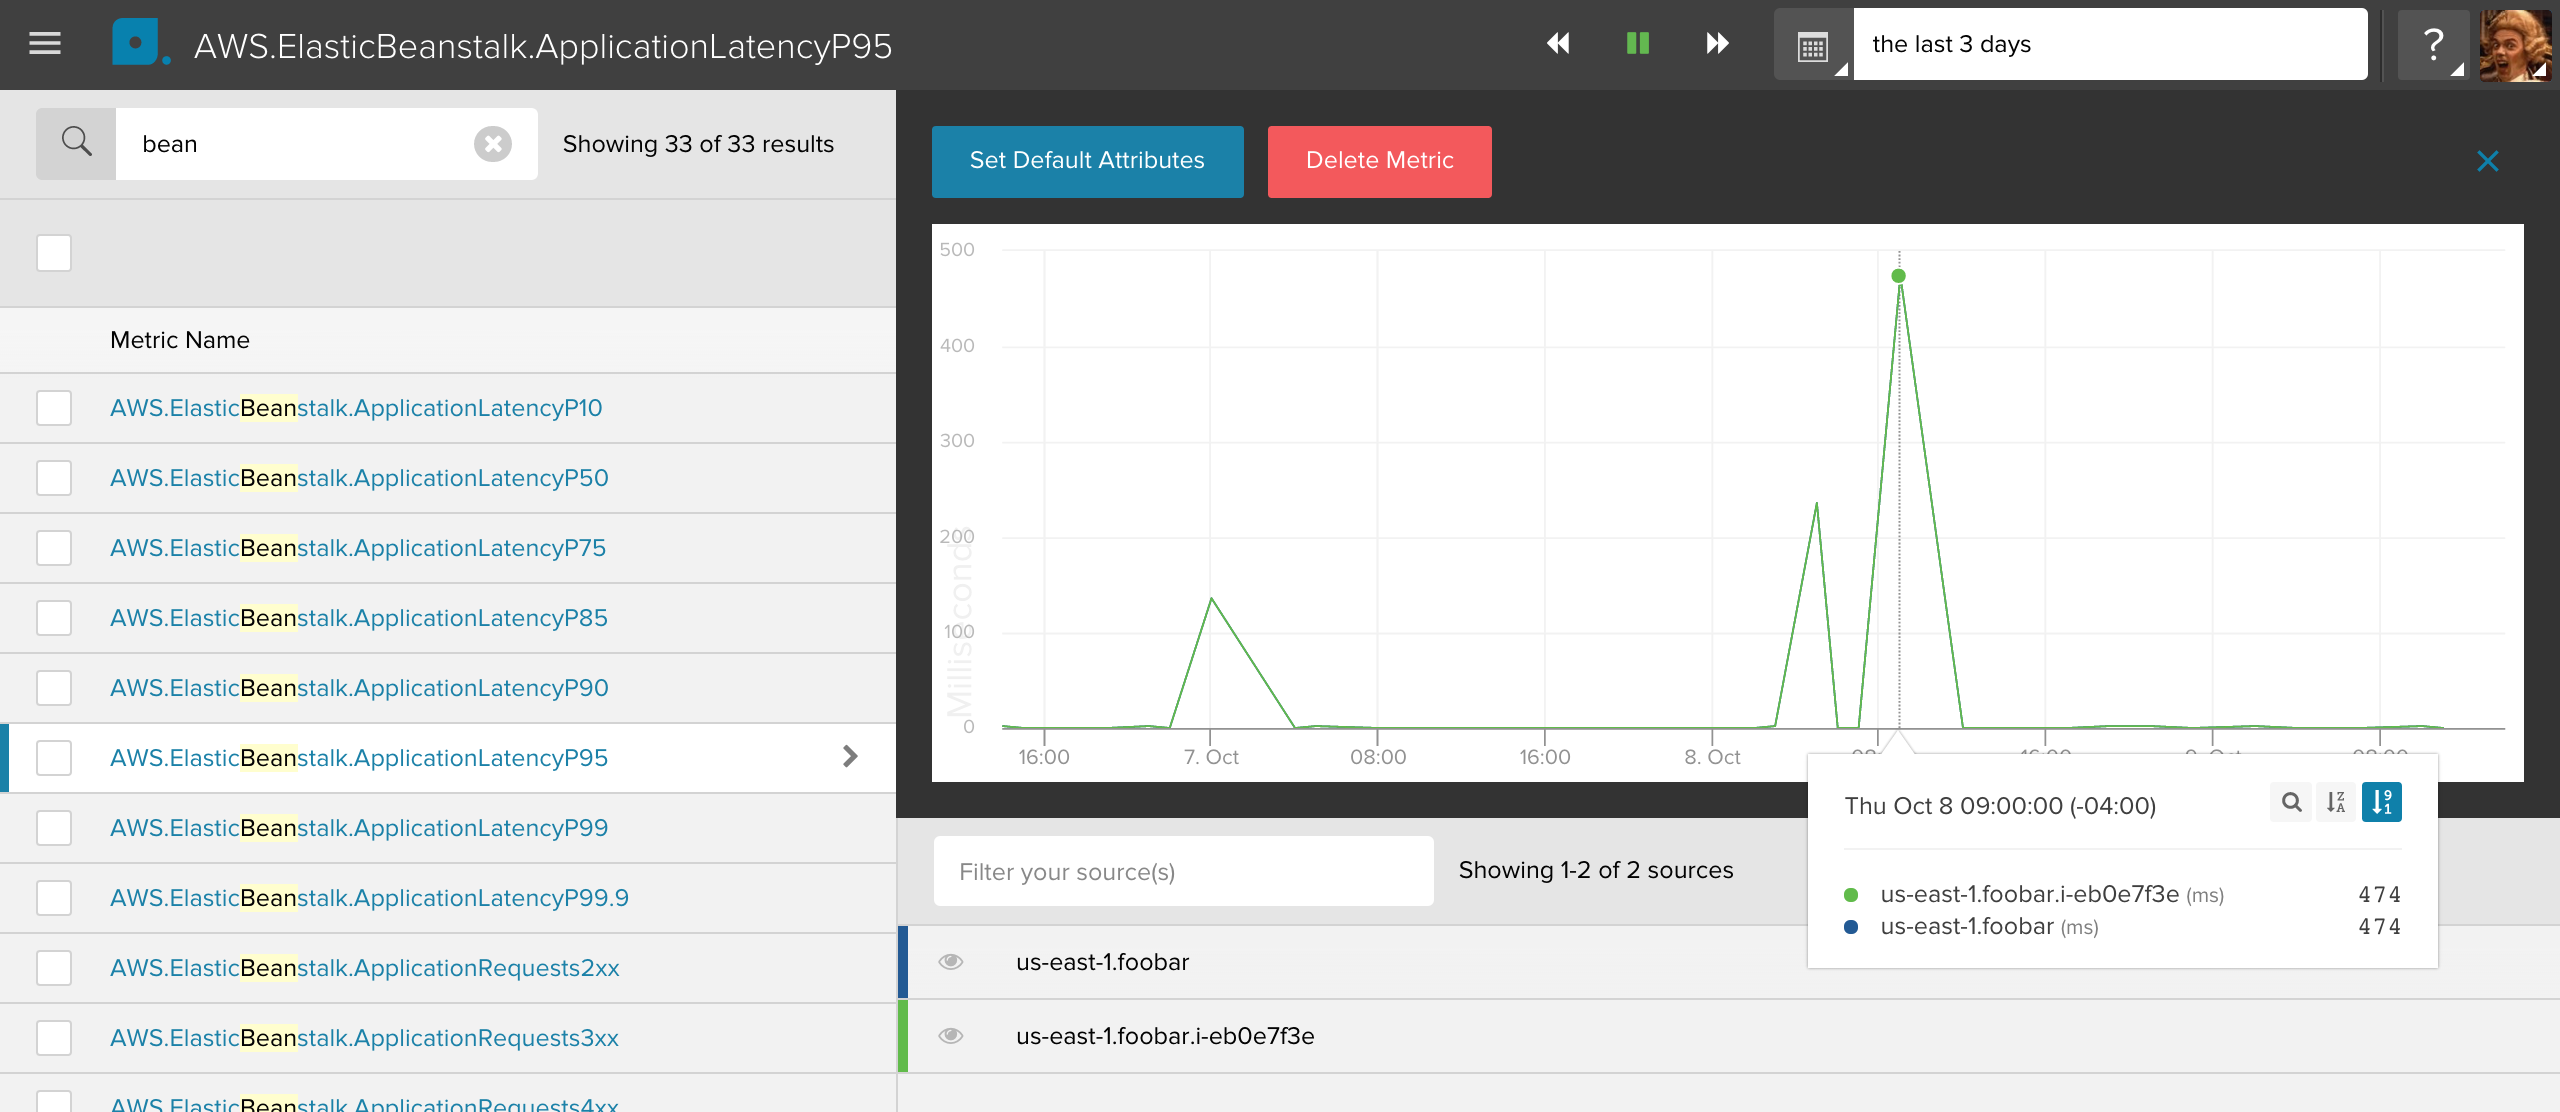
However, unlike other CloudWatch custom metrics, you’ll find these
metrics under the AWS.ElasticBeanstalk. namespace. If the metric
is an Environment metric, its source will include the concatenated
region and environment name. Instance metrics will record a source
with the region, environment name and its instance ID, e.g.
us-east-1.webprod.i-eb0e7f3b.