
AWS CloudWatch
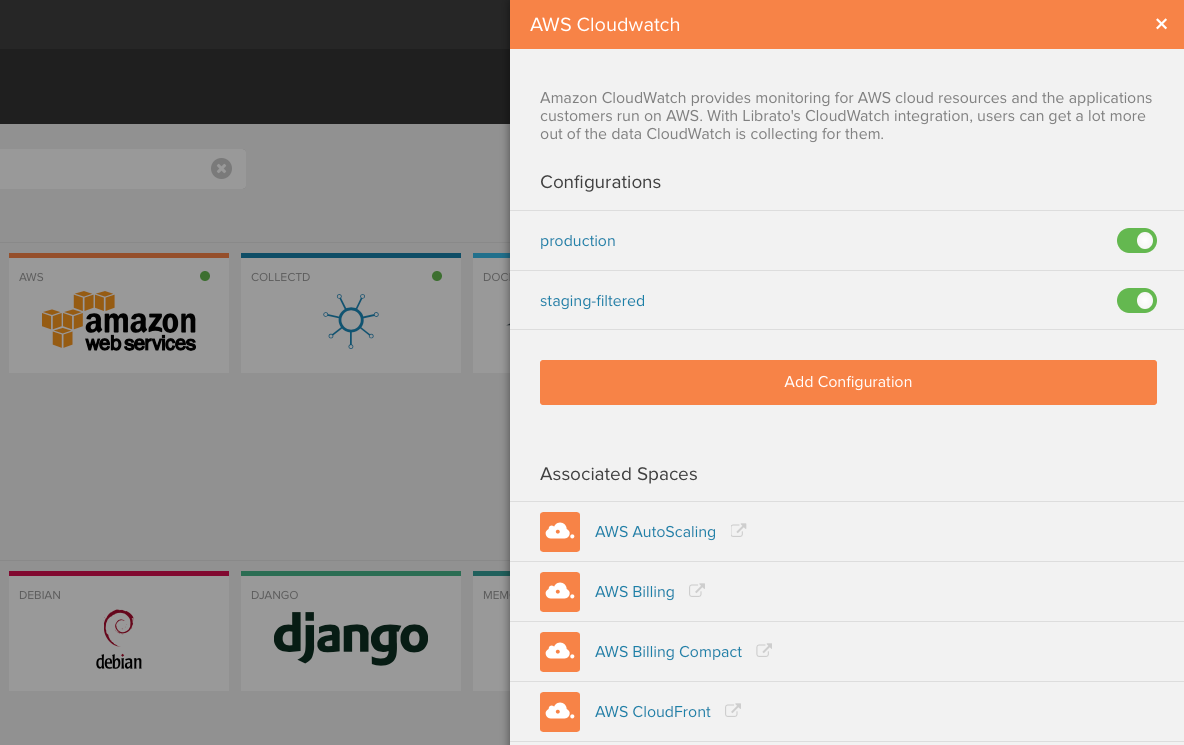
Amazon CloudWatch provides monitoring for AWS cloud resources and the applications customers run on AWS. With Librato’s CloudWatch integration, users can get a lot more out of the data CloudWatch is collecting for them.
Creating read-only AWS credentials
Before you start using the integration, we recommend setting up a new read-only AWS user.
Step 1. Login to AWS IAM Management Console
Step 2. Create a New User
- Select ‘Generate Access Token for each user’
- Download CSV of credentials
Step 3. View details of New User created.
- Under Permission select the Inline Policy dropdown creation link
- Select Custom Policy
- Paste the below custom policy
(If you’re not using a service, feel free to omit it):
{
  "Version": "2012-10-17",
  "Statement": [
    {
      "Effect": "Allow",
      "Action": [
        "cloudwatch:GetMetricStatistics",
        "cloudwatch:ListMetrics",
        "dynamodb:ListTables",
        "ec2:DescribeInstances",
        "ec2:DescribeVolumes",
        "ec2:DescribeVpnConnections",
        "ecs:ListClusters",
        "ecs:DescribeClusters",
        "elasticache:describeCacheClusters",
        "elasticbeanstalk:DescribeEnvironments",
        "elasticloadbalancing:DescribeLoadBalancers",
        "elasticloadbalancing:DescribeTags",
        "elasticmapreduce:ListClusters",
        "rds:DescribeDBInstances",
        "rds:DescribeDBClusters",
        "ses:GetSendQuota",
        "ses:GetSendStatistics",
        "sqs:ListQueues",
        "lambda:ListFunctions"
     ],
      "Resource": "*"
    }
  ]
}
You can then add your User to a Group and generate an Access Key for the user (or use the Access Key generated when you created the User) to use in the Librato AWS integration.
Why do we need so many permissions?
We obviously need the “cloudwatch” permissions to import the actual data, but what about all the others? The Cloudwatch list-metrics API call includes all metrics that have had any data reported for them in the last two weeks, even if the instance, database or other resource has been terminated or deleted. This can result in our integration continuing to make 100s of requests for things that haven’t had any new data in several days. To save on costs, both to our integration importer having to do extra work, and also for you having to pay for all those additional AWS API calls, we use the relevant “DescribeX” API call to determine which resources are actively running so we can limit our importing to only those.
Importing your CloudWatch metrics to Librato.
Prerequisite to start using this integration is that you have a Librato account. If you do not already have one, sign up for a free trial - it only requires an email address.
After you sign in to your Librato account, you will see a welcome screen that will guide you through the process of setting up your CloudWatch integration.
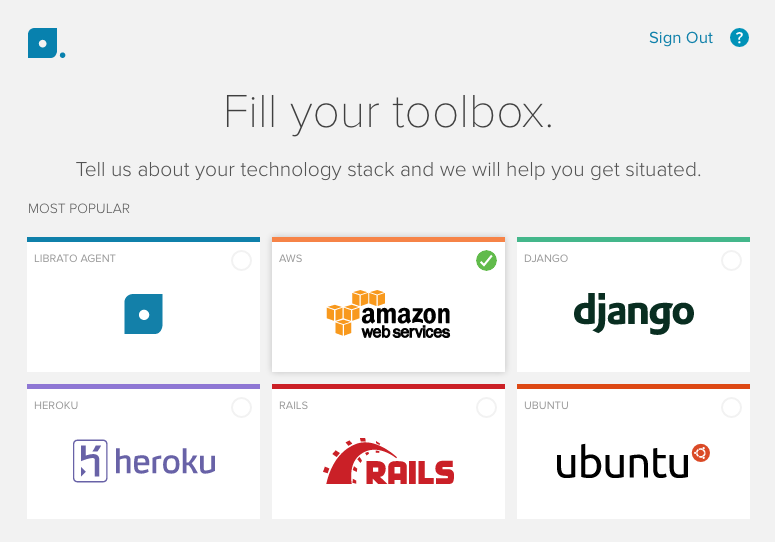
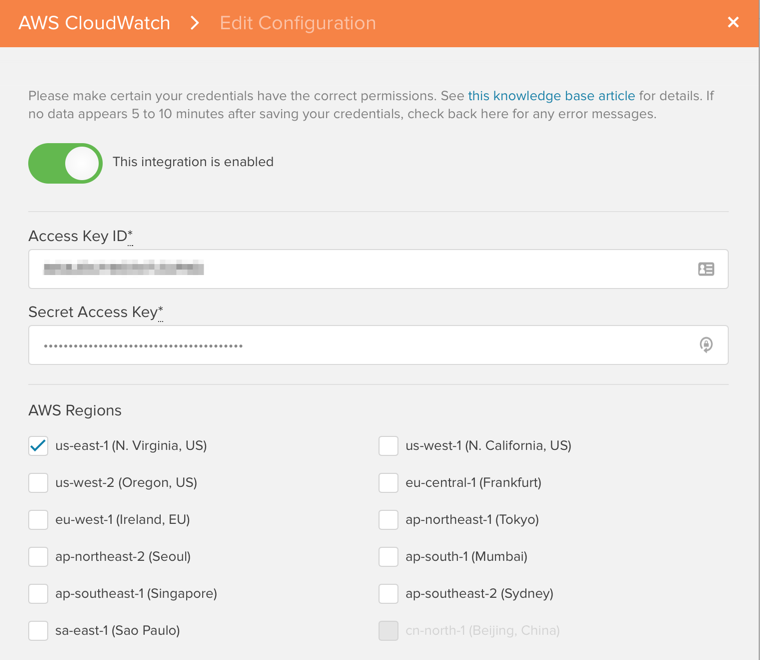
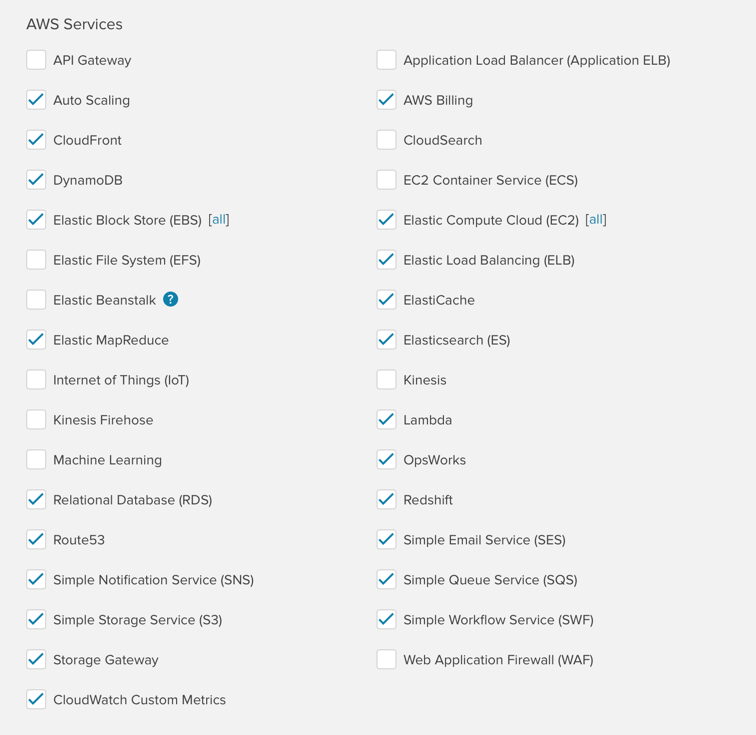
Select the “Amazon Web Services” option and proceed to the next step. After providing a title for your new integration you will be prompted to enter the read-only AWS Access Key ID and Secret Access Key you created earlier. Select an AWS Region and check the AWS Services you’re interested in tracking.
You can import metrics from as many instances as you want but as a precautionary measure we have set a limit to 250 instances. If you want that limit removed just send us an email to technicalsupport@solarwinds.com.
Note
Once the integration is saved, it can take 10-15 minutes to start seeing metrics in our system. We query the previous 1 hour and all subsequent data.
Multiple AWS Accounts
You can add multiple AWS accounts by just clicking on “Add a new AWS CloudWatch Integration”. An empty form will appear. Save the form when you done and you will see a new integration show up in the list.
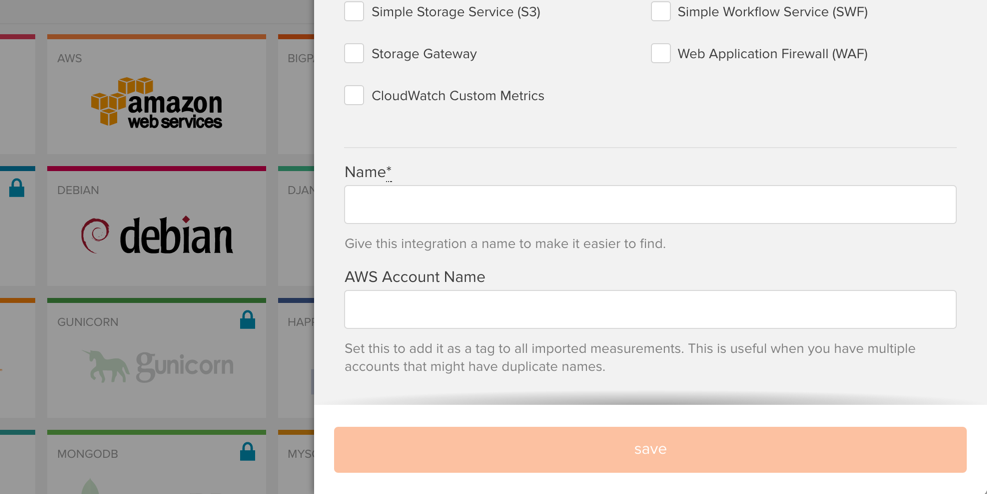
There are two optional fields when configuring the integration. The first, “Name”, is a free text field you may use to help you find a particular integration in the list, but has no bearing the the operation of the import. The second, “AWS Account Name” will add an additional tag to measurements imported by the account’s configuration. This is particularly useful to disambiguate multiple AWS accounts when creating charts or filtering data on Spaces.
Regions and Services
Use the checkboxes for the regions and services to determine which metrics you import.
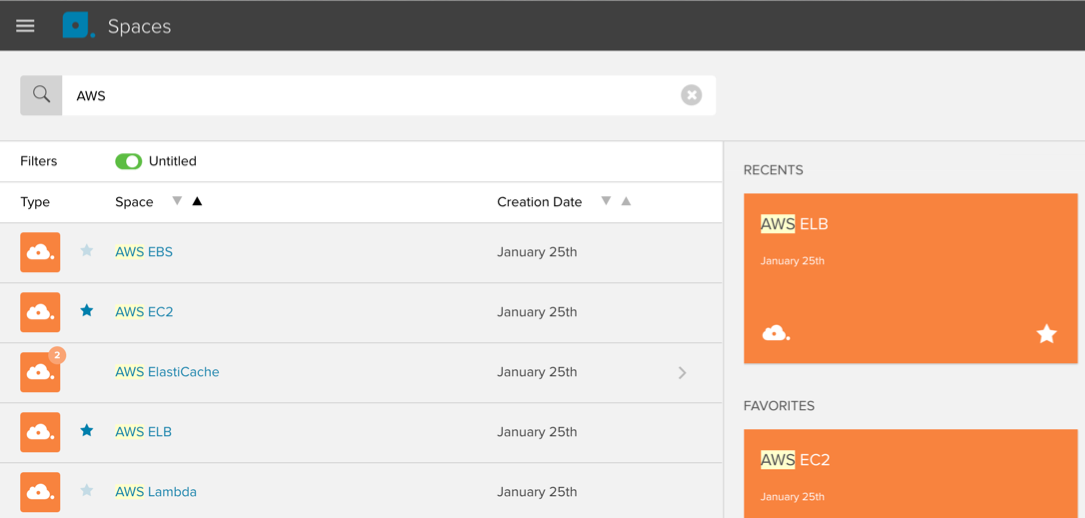
Curated AWS Spaces
Once your credentials are set up and saved, you can navigate to the Spaces list and see the AWS workspaces we have automatically created for each service. They are easily distinguishable by their “AWS-orange” color.
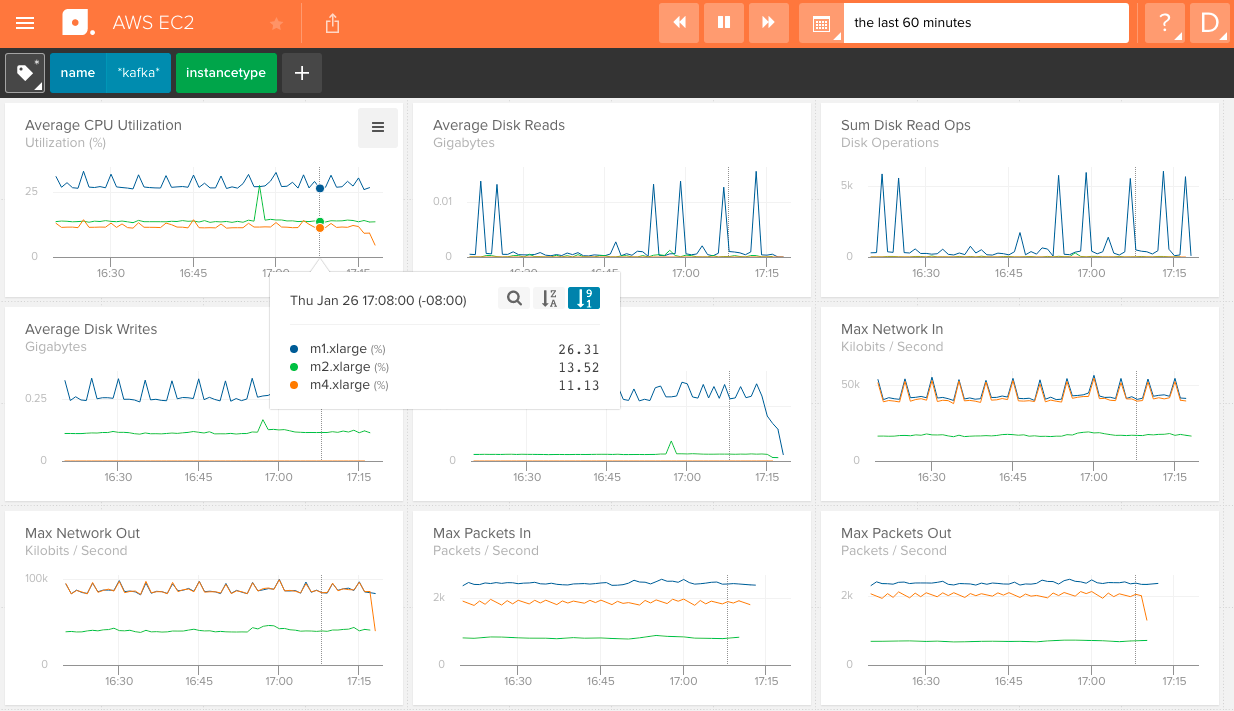
Curated Spaces are intended to give you a starting point to easily view
AWS service specific metrics. The tag bar shows the standard, AWS provided
tags such as name, instanceid, instancetype, az, region, etc. for EC2.
Note
It can take up to 10 minutes for CloudWatch metrics to show up in your account.
The Spaces are created as templates using the dynamic tags feature. Within the tag bar you can filter or group on tags which will render the corresponding metric streams on your charts.
To see custom tags, or to customize charts, you need to create a custom workspace.
Custom Tags and Custom Spaces
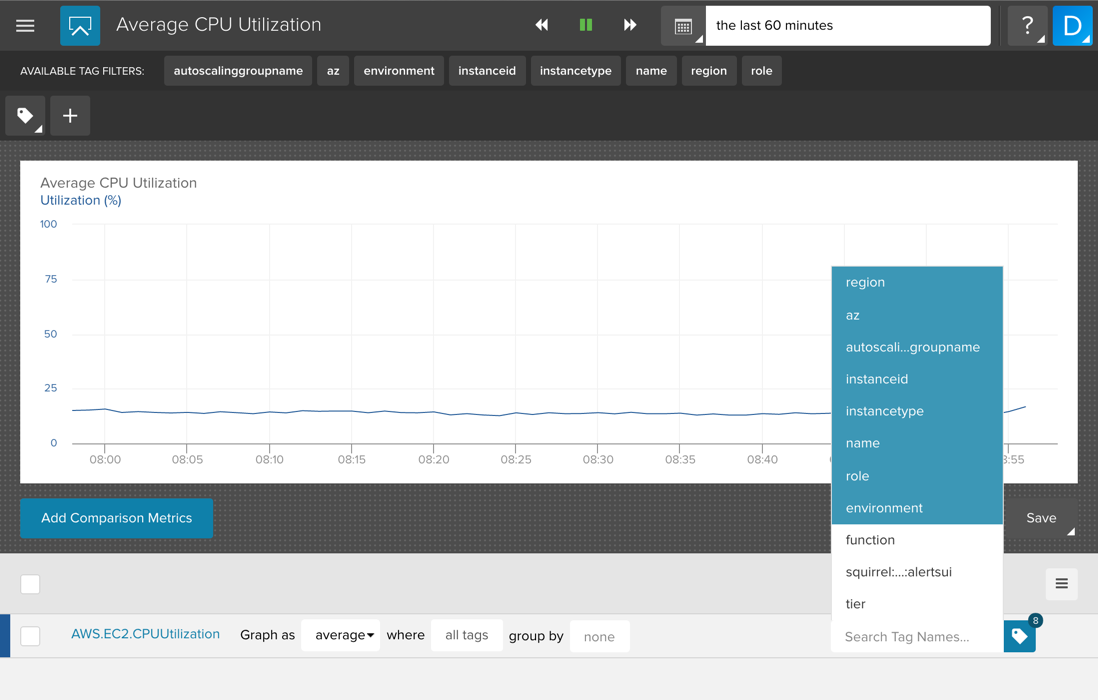
If you have added custom tags to your AWS metrics and want to use them in the Librato app, you need to create a custom Space. You can either start from scratch by creating a new Space or you can copy one of the curated AWS Spaces (see Copy Spaces). You will notice that the header bar is now blue, indicating that the Space is custom and therefore editable.
If you double-click on one of the charts, and click on the tag symbol to the right of a metric stream row, you will see the custom tags you created within AWS. Click on the custom tags and they will appear in the tag bar at the top of the screen.
Note
We currently only import custom tags for EC2, ELB and AWS custom metrics.
Note
Custom tags in the tag bar will only affect the metrics on a chart that have that specific tag set to “dynamic”.
Filtering Metrics
Librato supports the ability to filter by tag for EBS and EC2 resources. In the Cloudwatch integration, the EBS and EC2 service types have an additional input option next to each service type (when checked). This input is a toggle for two states: all or filtered.
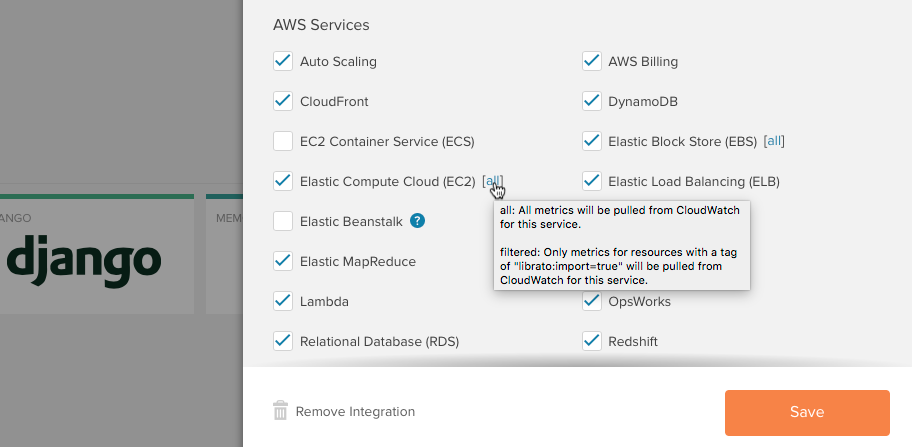
The default state is all, which is to collect all resource metrics from CloudWatch for the respective service type. If you click on the link it will toggle to filtered; in this state we white-list metrics coming from resources with the following tag applied:
librato:import=true
… where librato:import is the key and true is the value.
For example, if you are using the EC2 command line tool you would
apply the tag to an instance like:
ec2tag <instance id> -t librato:import=true
Or in the AWS Console:
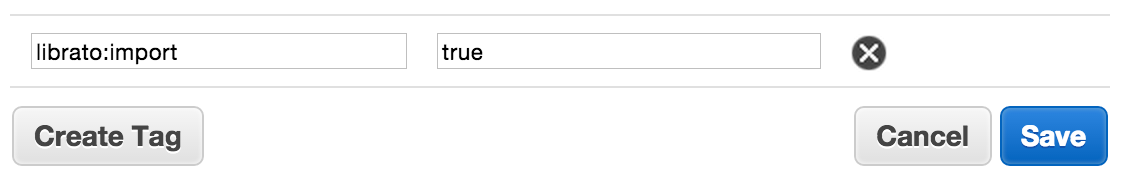
Stop Importing CloudWatch Metrics
To stop importing CloudWatch metrics, either hit the delete button to remove your IAM credentials or un-check the AWS Regions and AWS Services boxes and save.
After Setup Is Complete
After you have completed your setup, you should start seeing metrics flow into your account within 10-15 minutes. If that is not the case, check the Integrations page for any errors that may be present. The error message will give you a hint on what needs to be corrected. If you need help please send us an email.
Metric Namespaces
Depending on the CloudWatch services you have selected, Librato will create metrics in the namespaces following the pattern:
AWS.<service-name>
Elastic Beanstalk
To learn how to enable the Elastic Beanstalk service in your Librato CloudWatch Integration so that you can import all of your enhanced health metrics into your Librato account and preconfigured AWS Elastic Beanstalk space read: AWS CloudWatch: Elastic Beanstalk enhanced health metrics
Custom Metrics
Librato is a platform designed for custom metrics. You can use any of the pre-integrated collection agents or language bindings to add metrics to Librato and then add them to your AWS service graphs or Spaces. For example you can run The Librato Agent on your AWS instances to pull in memory and other metrics that CloudWatch doesn’t provide.
You can also pull in CloudWatch custom metrics by checking the box under AWS Service in your AWS Configuration. To learn more about CloudWatch custom metrics, see Amazon’s “Publish Custom Metrics” article. Keep in mind that if you pull in CloudWatch custom metrics you will not only be charged by Amazon but also by Librato. Amazon currently charges $0.30 per custom metric per month and Librato’s cost for 5 minute metrics is $0.05 per month. As Librato was designed for custom metrics, you might consider sending the metrics directly to Librato’s RESTful API, thereby saving cost and gaining control over the metric resolution.
Note
Once a new custom metric is added to Cloudwatch, it may take up to 30 minutes to appear in Librato. This is because we maintain a cached enumerated list in Librato, that expires every 30 minutes.
Reporting Intervals
Depending on the service, CloudWatch metrics are reported at either a 5 minute frequency or a 1 minute frequency. If you want EC2 data at a 1 minute frequency, you’ll need to enable “Detailed Monitoring” (see http://aws.amazon.com/cloudwatch/details). Note that ELB, RDS, ElastiCache, and some other services have 1 minute intervals by default. Using the AWS credentials you have provided, Librato will poll your CloudWatch metrics every 5 minutes and then write the resulting data into your Librato account, back-filling data that is at 1 minute resolution.
FAQ:
Can I import data from multiple CloudWatch accounts?
Yes you can. Just click on the AWS Integration icon on of your Integrations page and you will see a list of all the current configurations. Click on the “Add Configuration” button to add another.
How much does it cost to add CloudWatch metrics?
AWS CloudWatch metrics vary in both the number of metrics reported per service and the reporting interval. The default configuration for Amazon CloudWatch EC2 instance metrics for example is to report 10 metrics at 5 minute intervals. Please note that we have to make API calls on your behalf which Amazon charges for (see the last paragraph in this article).
If you are subscribed to the Developer plan you can track up to 100 metrics for free, so you can track up to 10 EC2 instances.
The Production Plan does not limit the number of metrics. A single metric reporting every 5 minutes costs $0.05 per month and 1 minute resolution metric (used for detailed monitoring of EC2 instances) costs $0.10 per month.
Below is a list of what basic CloudWatch metrics cost for each service per instance per month:
| AWS Service | Metrics | Cost/Instance | Comment |
|---|---|---|---|
| API Gateway | 7 | $0.70 | 1min metrics |
| AWS Billing | 1 | $0.05 | Reports every 4 hours |
| Cloudfront | 6 | $0.60 | 1min metrics |
| DynamoDB | 22 | $1.10 | 5min metrics |
| EC2 Container Service (ECS) | 4 | $0.40 | 1min metrics |
| Elastic Block Store (EBS) | 10 | $0.50 | 5min metrics |
| EBS Provisioned IOPS (SSD) | 10 | $1.00 | 1min metrics |
| Elastic File System (EFS) | 8 | $0.80 | 1min metrics |
| Elastic Compute Cloud (EC2) | 14 | $0.85 | 1min (3) & 5min (11) metrics |
| Elastic Load Balancing | 13 | $1.30 | 1min metrics |
| Elastic Beanstalk (Enhanced Health) | 33 | $3.30 | 1min metrics |
| ElastiCache Host-Level Metrics | 5 | $0.50 | 1min metrics |
| ElastiCache Redis | 17 | $1.70 | 1min metrics |
| ElastiCache Memcached | 34 | $3.40 | 1min metrics |
| Elastic MapReduce | 26 | $1.30 | 5min metrics |
| Elastic Search | 20 | $2.00 | 1min metrics |
| Internet of Things (IoT) | 9 | $0.90 | 1min metrics |
| Kinesis | 17 | $1.70 | 1min metrics |
| Kinesis Firehose | 25 | $2.50 | 1min metrics |
| Lambda | 4 | Variable* | 1min & sparse metrics |
| OpsWorks | 15 | $0.75 | 5min metrics |
| Relational Database (RDS) | 18 | $1.70 | 1min (16) & 5min (2) metrics |
| Redshift | 13 | $1.30 | 1min metrics |
| Route53 | 2 | $0.20 | 1min metrics |
| Simple Notification Service (SNS) | 4 | $0.20 | 5min metrics |
| Simple Queue Service (SQS) | 8 | $0.40 | 5min metrics |
| Simple Storage Service (S3) | 2 | $0.10 | Reports every 24 hours |
| Simple Workflow Service (SWF) | 21 | $2.10 | 1min metrics |
| Storage Gateway | 11 | $0.55 | 5min metrics |
| Web Application Firewall (WAF) | 3 | $0.30 | 1min metrics |
| CloudWatch Custom Metrics | 1 | $0.10 | 1min resolution |
* Cost of Lambda monitoring: If the job is running all the time, it will be charged as a 1 minute metric (4 metrics * $0.10 = $0.40). If it runs sparsely, the charge will be fractions of a cent.
A note about custom metrics…
Librato does not charge per Alert or API call and there is no limit to the amount of custom metrics you can send us. If you send custom metrics to AWS and then import them to Librato you are paying twice whereas if you only send them to Librato you only pay once. 5min metrics only cost $0.05/mo and 1min metrics cost $0.10/mo. If you’re an extensive user of Alerts and Custom Metrics, you may even save money by using Librato!
Activating billing metrics
Before you can see data on your estimated charges, you must enable monitoring in AWS, which creates the metric data. To learn how, see the article “Enabling the Monitoring of Your Estimated Charges “. Note that AWS Billing reports every 4 hours so it may take a while for you to see your data. Also note that you may need to activate the integration for us-east-1 (N. Virginia, US). From the AWS documentation: “Billing metric data is stored in the US East (N. Virginia) region and represent worldwide charges”
Will I be charged for the AWS API requests?
Yes. Amazon charges a fee (currently $0.01 per 1,000 requests) for CloudWatch API access exceeding 1 million requests/month and these accrue on the account associated with the credentials you provide. Currently we poll the AWS services every 5 minutes and make one API call for each metric instance that we are tracking.
Do you support Auto Scaling Groups?
We do support Auto Scaling Group metrics such as “GroupMinSize”, “GroupMaxSize”, “GroupTotalInstances”, etc as shown in Amazon’s Use Amazon CloudWatch to Monitor Your Auto Scaling Instances article.
To filter the metrics for your Auto Scaling group by group name, use the
AutoScalingGroupName tag.
Can I use Service-Side Aggregation (SSA) on CloudWatch metrics?
Sadly, no. Because of the “polling” nature of the Librato / CloudWatch integration, there can be issues with the timing of data coming out of CloudWatch and into Librato. Since SSA essentially “waits” for measurements to come in during the aggregation period (say, 60s), and we pull data from CloudWatch based on the “last reported” values, timing issues may occur and the possibility of bad data (double counting) is introduced. For this reason, we do not recommend using SSA for your CloudWatch metrics.