Apache

Apache is an open-source HTTP server for modern operating systems including UNIX and Windows. It is the world’s most used web server software and is estimated to serve 50% of all active websites and 37% of the top servers across all domains.
The Librato Agent allows you to easily monitor the health
of your Apache service(s). Use our agent’s Apache plugin to gather
metrics from the running Apache server. It requires that the mod_status
module is enabled.
Installation
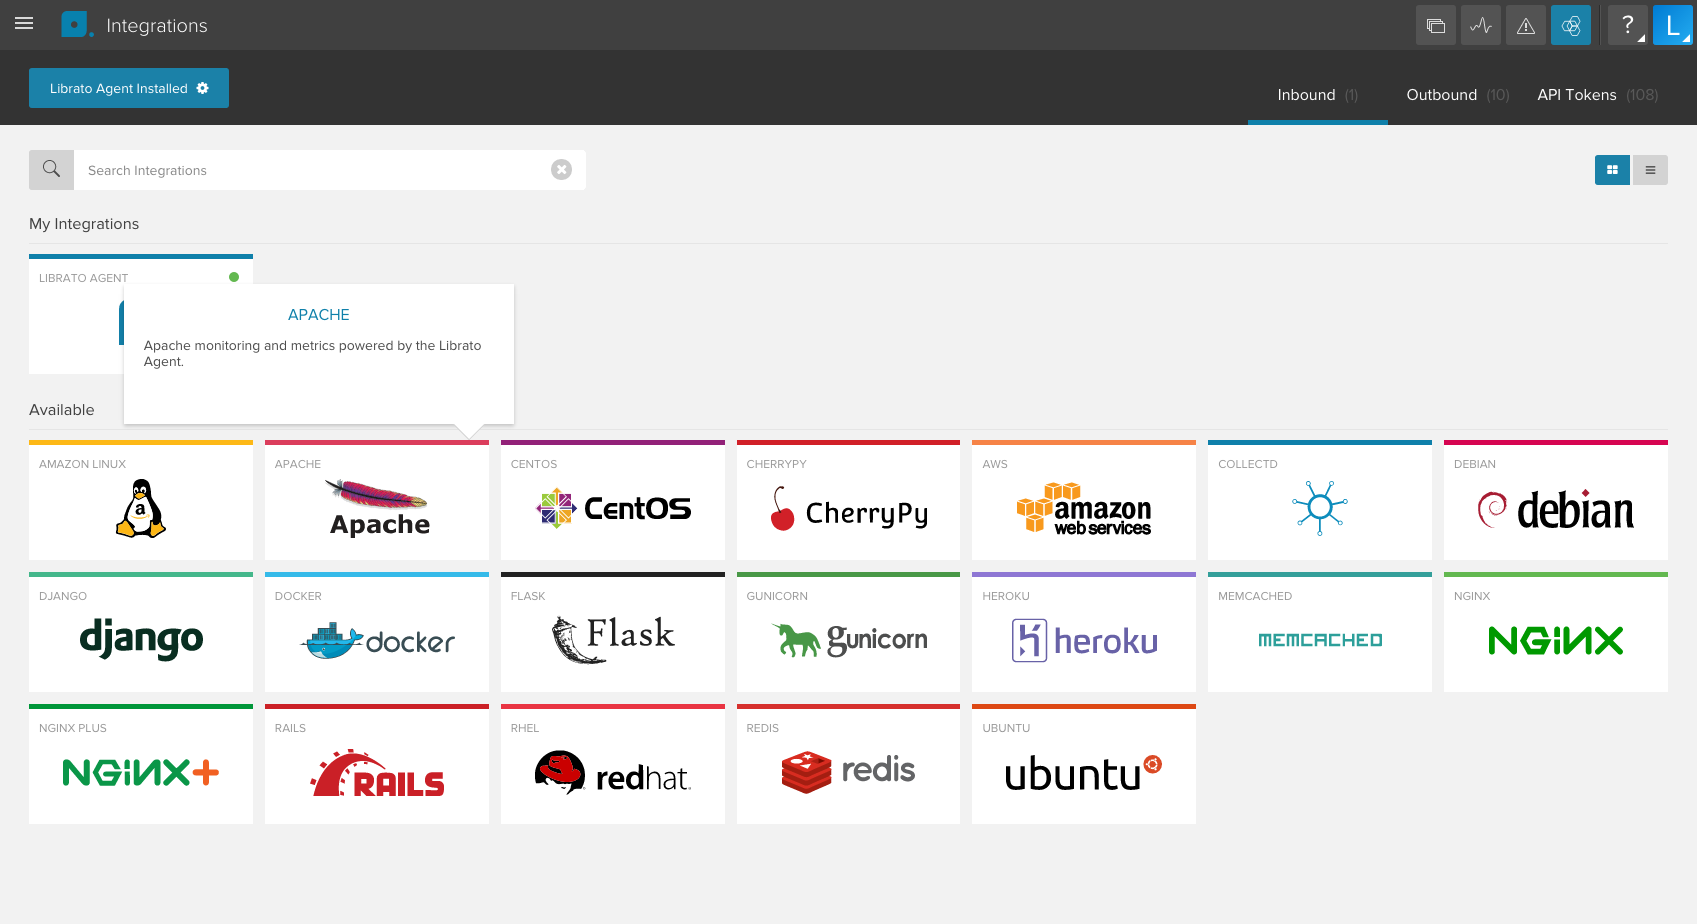
The Apache integration depends on the Librato Agent. If you haven’t already, you will first need to install the Librato Agent. Once this is complete, select the Apache icon in the integrations catalogue.

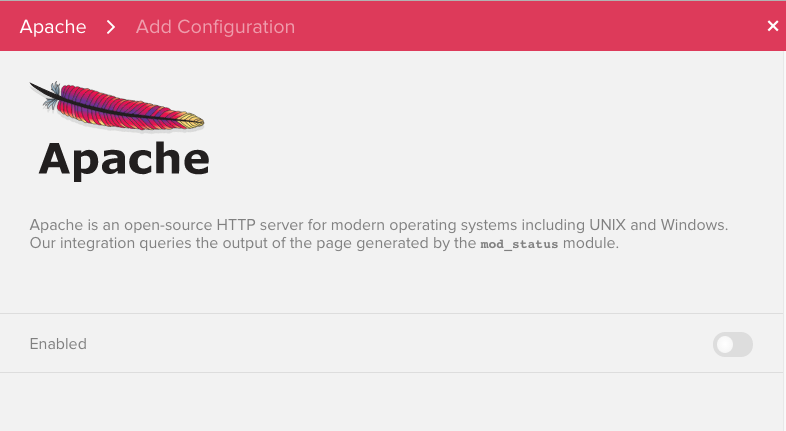
Toggle the Enabled switch to activate the Apache integration on your Librato account and create the preconfigured Apache Space.

At this point your integration is complete and any Apache metrics associated with this integration will be allowed through your Librato Agent service-side filters.
Plugin Configuration
The Apache server being monitored must have the mod_status module
enabled. This is usually not enabled by default.
Your Apache server will need a location defined with the
mod_status module activated. Here is a sample definition that
allows connections from the local agent and works with our default
plugin configuration.
ExtendedStatus on
<Location /server-status>
  SetHandler server-status
</Location>
Note: The ExtendedStatus option is not required but is recommended. Details of the metrics provided by ExtendedStatus
can be found here.
Alternatively, you can adjust the URL setting, for your instance, in the
/opt/collectd/etc/collectd.conf.d/apache.conf configuration file to
match your particular setup.
Please note that the query string ?auto must be appended to the location. This allows our agent to properly work with Apache’s mod_status module.
LoadPlugin apache
<Plugin apache>
  <Instance "apache80">
    URL "http://127.0.0.1/server-status?auto"
  </Instance>
</Plugin>
Note: You must restart the Agent after any changes to your Librato Agent configuration files.
$ sudo service collectd restart
At this point you should begin seeing librato.apache.* metrics
in your Librato account.
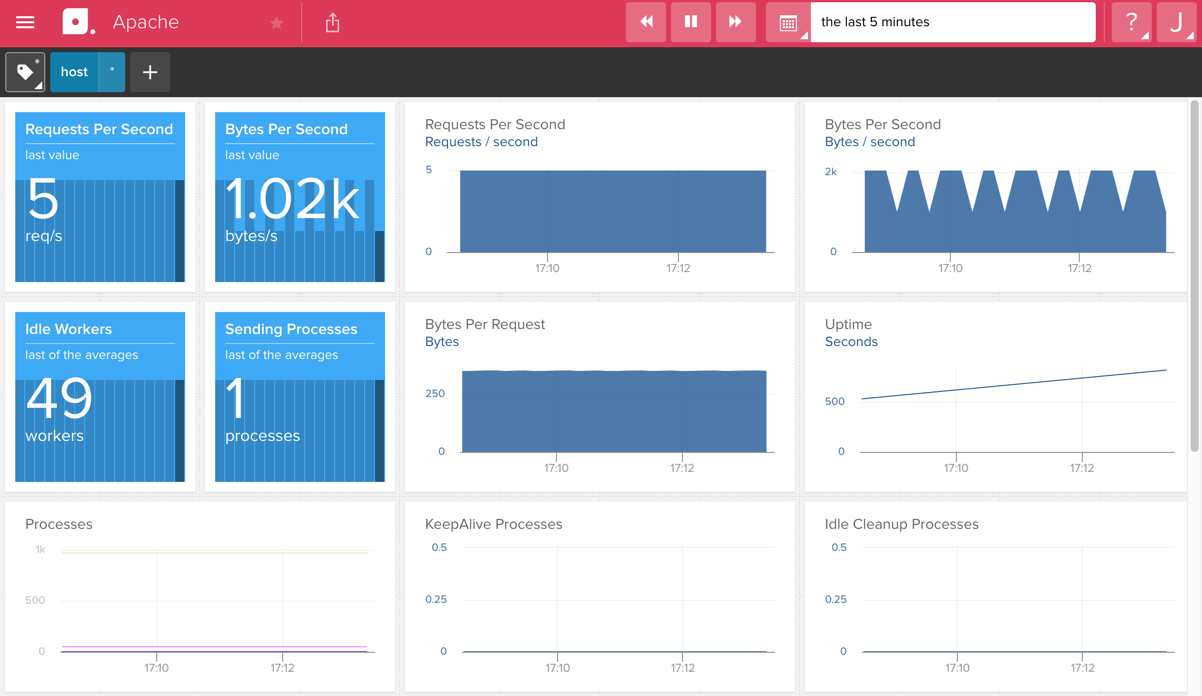
Apache Workspace
Visit your preconfigured Space to observe your new metrics as they stream in. You can use the tag field at the top to filter your view to a subset of hosts.

FAQ
For specific answers to Librato Agent questions check out our Librato Agent FAQ.
Please let us know what you think about this integration. We would love to incorporate your feedback and any ideas you have on dashboard design into the ongoing development of our integrations.

