
Librato Agent: FAQ
To learn how to set up the Librato agent, check out the Librato Agent article.
Here are some of the most common questions that come up in our support channels:
What metrics are monitored by the Librato Agent?
The Agent collects metrics in four different categories:
- CPU (8 metrics for each core plus 3 system-wide load-average metrics)
- MEMORY (11 metrics)
- DISK (17 metrics per mountpoint )
- NETWORK (8 metrics per interface)
See Librato Agent: Default Metrics for a comprehensive list of metrics collected by the Librato Agent.
Why are so many packages installed?
The Librato Agent is built on top of collectd with some modifications we’ve made to the configuration and core. As such, all dependencies are driven by the upstream collectd requirements. In our effort to maintain as much parity with upstream as possible, we have not modified any of the dependency requirements. For comparison, as of this writing, Ubuntu 14.04 installs about 50 packages which is around the same amount the Librato Agent requires.
I’m not seeing any metrics in my account (missing FQDN)
By default, the Librato Agent relies on the system’s full-qualified domain name
(FQDN) to set the metric source. If this is unavailable, Librato won’t be able
to accept the metrics from your agent. This is common when your primary
interface’s IP address is missing from the /etc/hosts file.
The hostname command can be used to test whether your system’s FQDN is set correctly.
      $ hostname -f
      hostname: Name or service not known

      $ sudo sh -c 'echo "172.30.0.188 ip-172-30-0-188" >> /etc/hosts'

      $ hostname -f
ip-172-30-0-188
The format of the hostname is actually important. Follow the same format using your instance’s IP address.
I’m receiving the error “Invalid JSON: Unexpected character” when running the agent.
Your server may be configured for a locale not supported by the Librato Agent. You’ll need to update your locale configuration to either “en_US.UTF-8” or “C”. Edit your /lib/systemd/system/collectd.service file and add the following lines to end of the file:
Environment="LANG=C"
Environment="LC_NUMERIC=C"
Once you have saved these changes, restart the Librato Agent:
sudo service collectd restart
Is it possible to customize the host tag for the Agent?
Yes. By default, the Librato Agent will use the hostname as the
host tag value. To use a custom hostname, simply create a user.conf file in
the Agent’s configuration directory with a custom Hostname
directive in it.
echo 'Hostname "your_source_name"' >> /opt/collectd/etc/collectd.conf.d/user.conf
Then restart the collectd service:
sudo service collectd restart
Can I change the reporting interval?
Yes. The Librato Agent reports on a 60-second interval by default. You
can change the reporting interval using the Interval parameter in
your /opt/collectd/etc/collectd.conf file and restarting the
collectd service.
sudo service collectd restart
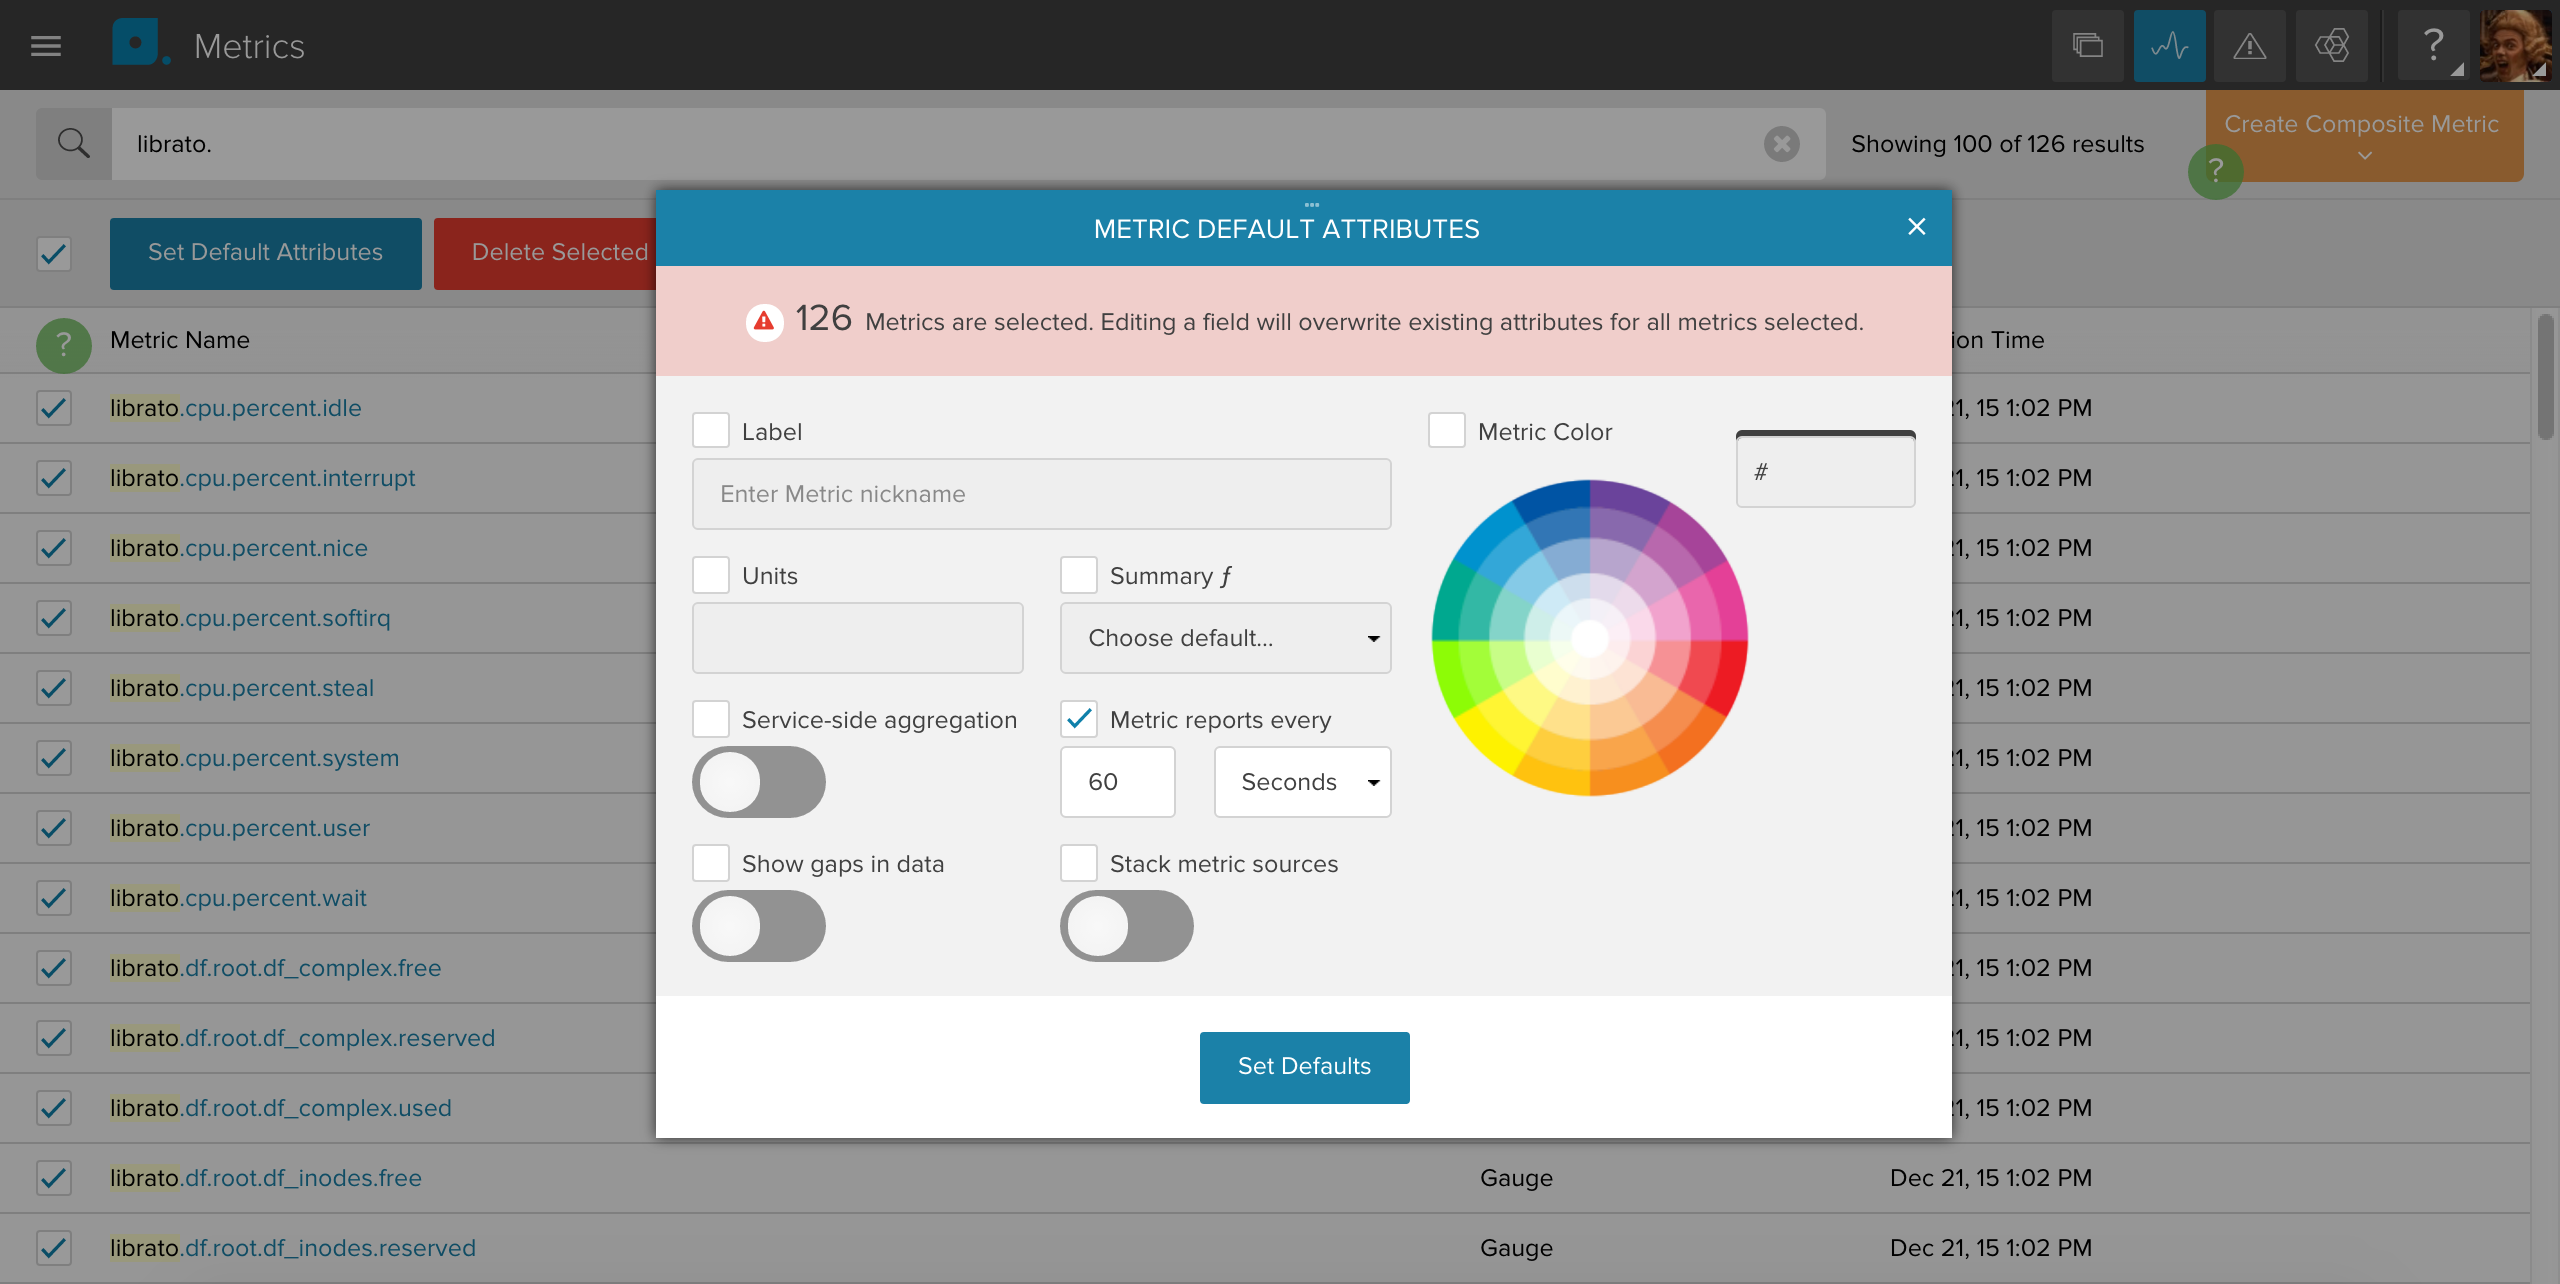
Additionally, you will want to update the default period for your preconfigured metric attributes. First, search for any metrics reported by the Librato Agent. Select all visible metrics (using the select-all checkbox) and then choose Set Default Attributes. This will open the attributes dialog where you can change the reporting interval. Click Set Defaults to save your changes.
How can I aggregate CPU metrics?
The Librato agent automatically reports the per-core CPU metrics as a
unified statistic (e.g. librato.cpu.percent.idle. No additional
configuration is necessary.
How much does it cost to monitor a server with the Librato Agent?
Librato charges based on what you store. Since the Librato agent generates different quantities of metrics depending on your hardware configuration, the cost of your server monitoring setup varies with the number of CPU’s mount-points and network interfaces on your systems. See the What metrics are monitored question above for an accurate count of the metrics generated by the Librato Agent.
Here are some simple estimates:
- system with 1 mountpoint and 1 network interface @60-second resolution: $4.20/server/mo
- system with 2 mountpoints and 2 network interfaces @60-second resolution: $7.10/server/mo
- system with 4 mountpoints and 2 network interfaces @60-second resolution: $10.60/server/mo
You can find an estimate of your monthly bill on your Account Settings page.
Can I whitelist any custom metrics for the Librato Agent?
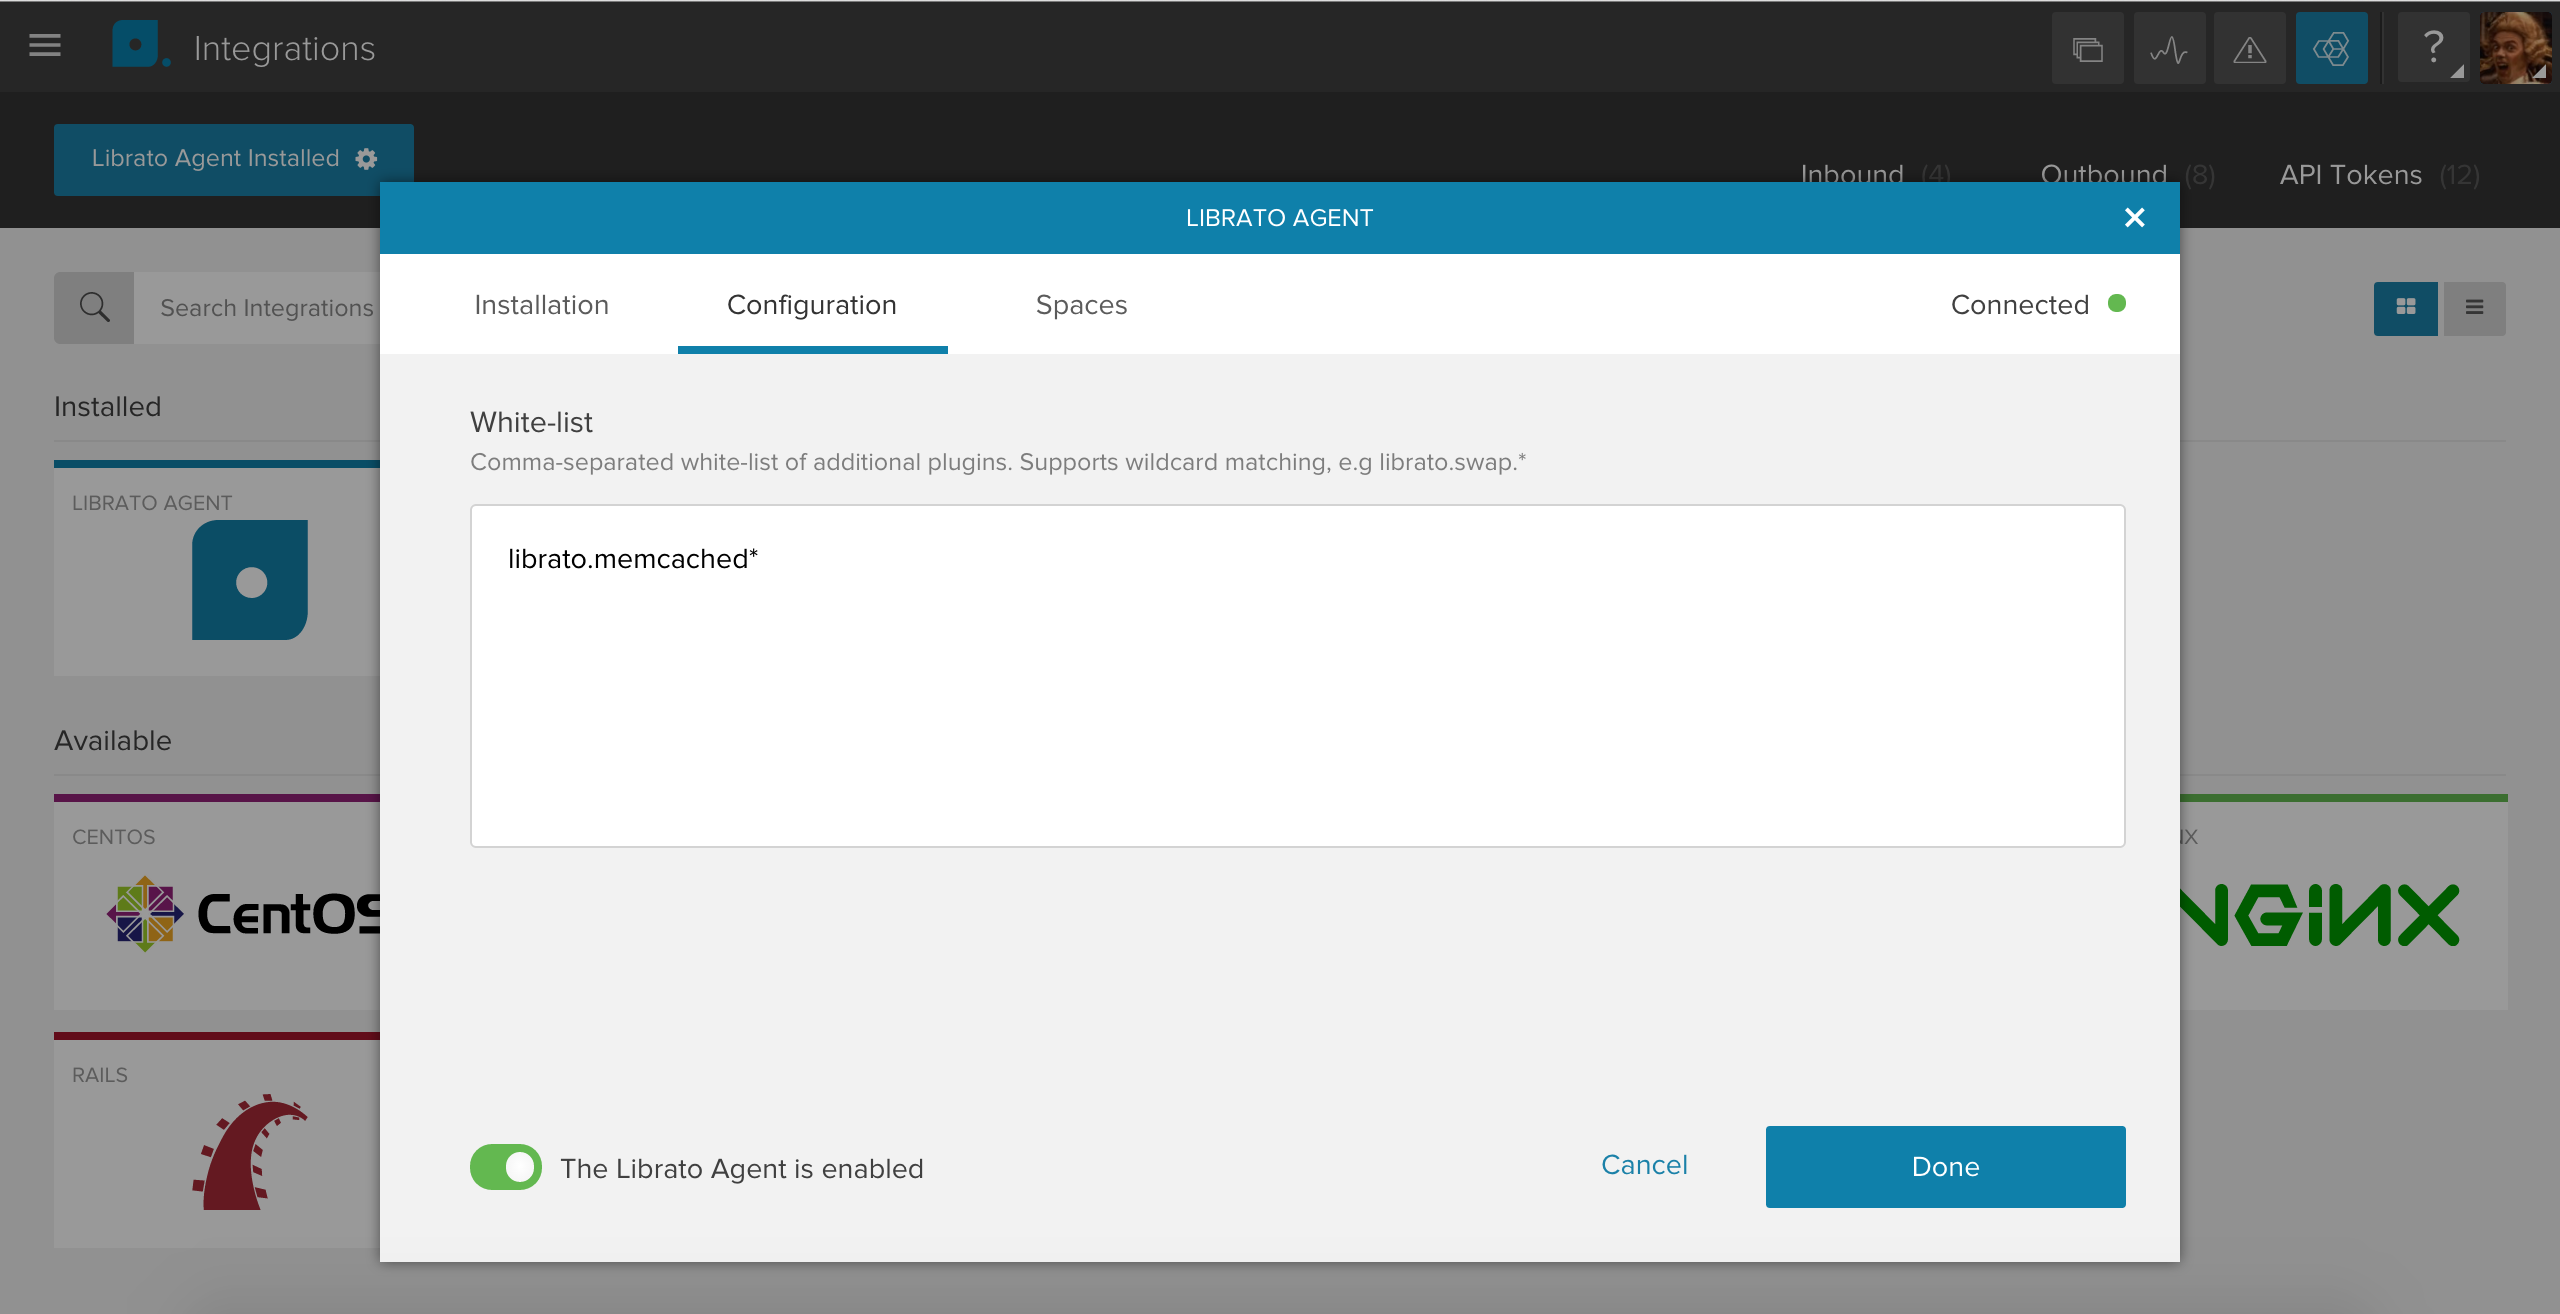
Yes. Any user-enabled plugins added to the user.conf will need to
be whitelisted so that Librato knows to allow them into your account.
This setting is found in the Agent’s configuration tab on the
integrations page.
Can I blacklist any of the core metrics reported by the Librato Agent?
Although not officially supported, the Librato Agent is compatible with all Collectd plugins. Take a look at the the Match:RegEx plugin for ideas. Here’s one filtering example found on the Internet:
LoadPlugin "match_regex"
  <Chain "PostCache">
    # only show read/write ops
    <Rule "ignore_disk_metrics">
      <Match "regex">
        Plugin "^disk"
        PluginInstance "^(dm|sd.*)"
        Type "^disk_(merged|octets|time)"
      </Match>
      Target "stop"
    </Rule>

    # Default target
    Target "write"
  </Chain>